How to Implement Change Data Capture Without Complexity
Discover how to implement change data capture without complexity. Our guide offers simple, modern methods for real-time data integration. Learn more!
Tired of wrestling with brittle, outdated data replication methods? If you’ve ever been burned by endless scripting and fragile batch jobs, you know there has to be a better way. So, how do you actually implement Change Data Capture without all the usual complexity?
The secret is to sidestep the DIY route entirely. A modern, managed platform replaces months of manual engineering with automated, pre-built connectors that just work, right out of the box.
The Simple Path to Modern Change Data Capture
When we say “without complexity,” we’re talking about more than just an easier setup. It’s about completely eliminating the constant maintenance, late-night troubleshooting, and manual fixes that plague traditional CDC approaches. Old-school CDC often felt like a massive, never-ending engineering project, demanding deep, specialized knowledge of database internals, log parsing, and distributed systems.
Modern managed platforms, like Streamkap, completely flip this script. Instead of you having to wrestle with transaction logs or stress about schema drift, your team gets to focus on what actually matters: using fresh, real-time data to make better business decisions. All the heavy lifting is handled behind the scenes.
This simplified approach completely changes the game:
- Forget Manual Scripting: Pre-built connectors for sources like PostgreSQL and destinations like Snowflake mean you just configure, you don’t code.
- Automated Schema Handling: When a developer inevitably adds a new column to a source table, the platform automatically detects and applies the change downstream. No more broken pipelines.
- Built-in Resilience: Features like exactly-once processing and automated recovery are standard, not complex add-ons you have to build and maintain yourself.
- Minimal Performance Hit: Log-based CDC is incredibly efficient. It reads changes directly from database transaction logs, adding a negligible load (often under 2-5% CPU) to your production systems.
A Quick Comparison
To see just how different the two approaches are, here’s a quick breakdown.
AspectTraditional CDC (Complex)Modern Managed CDC (Simple)SetupWeeks to months of custom engineering and scripting.Minutes to hours using a UI and pre-built connectors.MaintenanceConstant monitoring, patching, and manual fixes.Fully managed by the provider, with automated updates.Schema ChangesOften breaks the pipeline, requiring manual intervention.Handled automatically, ensuring pipeline resilience.PerformanceCan create significant load on source databases if not optimized.Minimal impact (<5% CPU) by reading transaction logs.ExpertiseRequires deep, specialized knowledge of databases and systems.Accessible to any data engineer or analyst.
This table really highlights why managed solutions have become the go-to for teams that want to move fast without building a whole new infrastructure department.
Embracing Real-Time Data Streams
The move toward real-time data isn’t just a trend; it’s a fundamental shift. Projections show that by 2025, a staggering 30% of all generated data will be real-time. This is backed by the $10.3 billion invested in data infrastructure startups in 2024 alone.
This surge makes efficient CDC a core business requirement, not just a nice-to-have. A managed platform is the most direct path to meeting this demand. For a deeper dive, check out our guide on the fundamentals of real-time data streaming.
The user interface of a platform like Streamkap brings this simplicity to life, turning complex sources and destinations into simple, configurable blocks you can connect visually.

This visual approach hides all the underlying complexity, letting engineers build and manage powerful data pipelines in a matter of minutes, not months.
Key Takeaway: Implementing CDC without complexity means choosing a solution that automates the hard parts—log reading, schema evolution, and fault tolerance. This lets you focus on business outcomes, not building and maintaining infrastructure.
Now, let’s walk through the practical steps of setting up a system like this. You’ll see firsthand just how accessible modern CDC can be for any data team.
Getting Your Database Ready for Real-Time Streaming
Before any data can start flowing, you have to get your source database configured to share its changes. Don’t worry, this isn’t a massive overhaul. It’s really just a few crucial settings that, in my experience, prevent about 90% of the common setup problems people run into.
Getting this groundwork right is the secret to a smooth, low-impact stream from day one.
These preparations all center around enabling a process called logical replication. This is a far more efficient method than older techniques that constantly query your database and create performance overhead. Instead, logical replication lets a tool like Streamkap passively read the database’s internal transaction log—the very same log the database itself relies on for recovery. It’s the most reliable source of truth for every single change, captured with almost no impact.
This flow chart gives you a quick visual of the three prerequisites we’re about to cover.
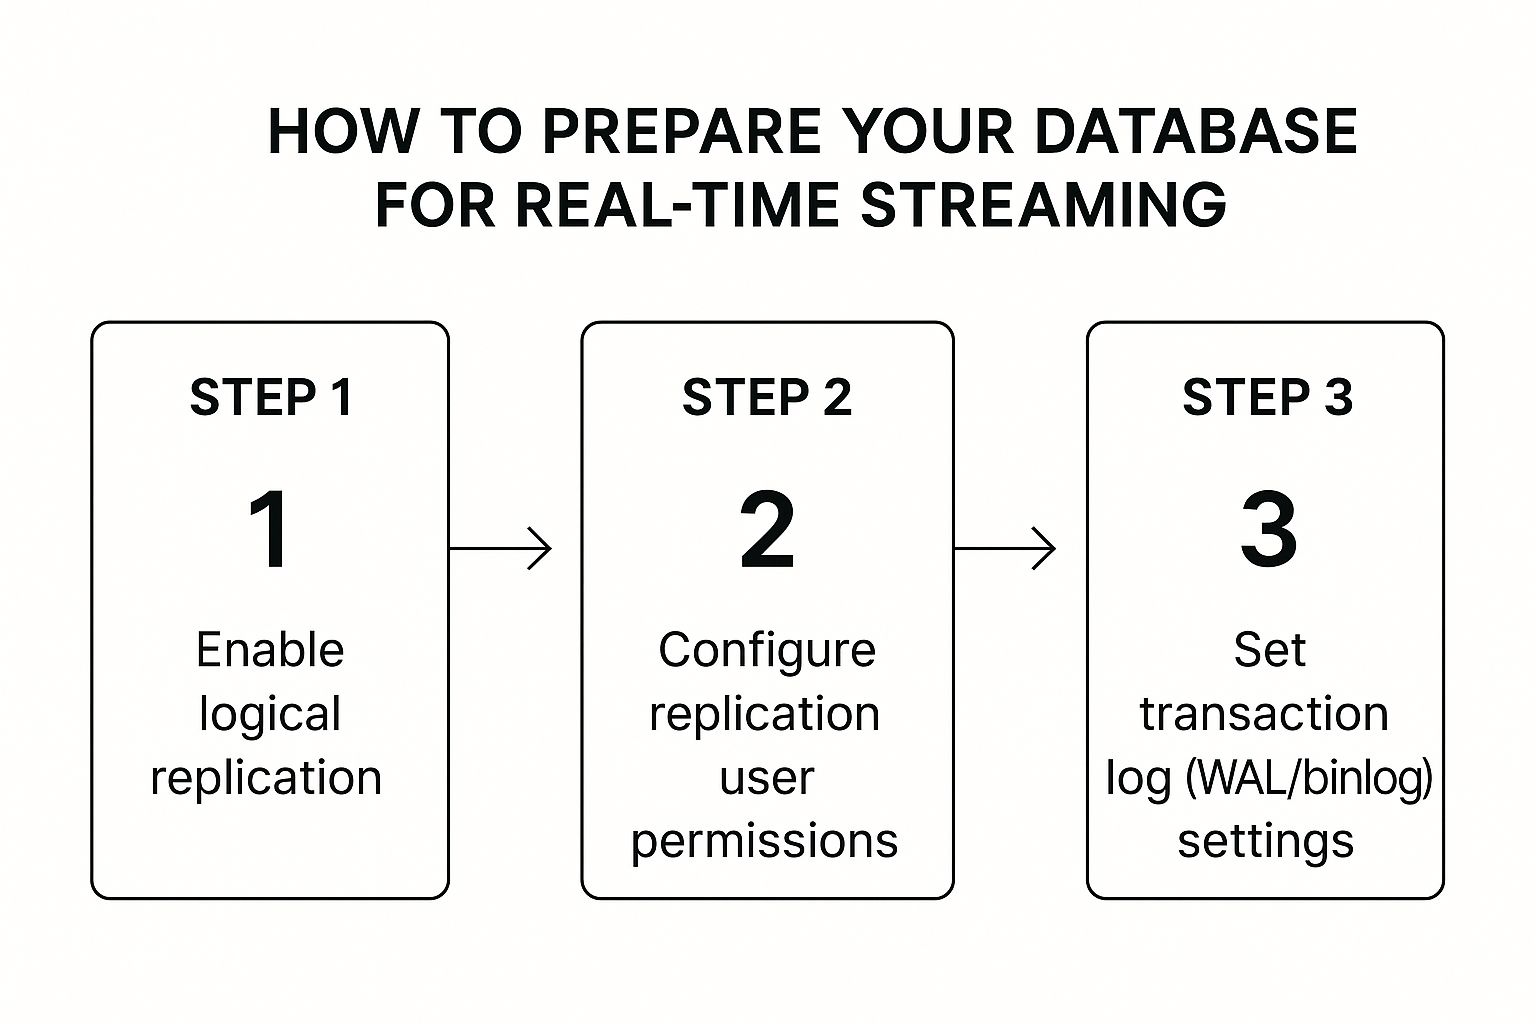
As you can see, it boils down to enabling replication, creating a dedicated user, and tweaking your log settings. Let’s walk through what that actually means.
Turning On Logical Replication
First things first, you need to tell your database it’s okay to share its change log. For a database like PostgreSQL, this is a straightforward change in the postgresql.conf file.
You’re looking for the wal_level parameter and you’ll need to set it to logical.
This one setting tells PostgreSQL to start writing much richer information into its Write-Ahead Log (WAL). Without it, the log just has enough data for crash recovery, but with logical enabled, it contains enough detail to reconstruct the exact row-level changes for an external stream.
Setting Up the Right User Permissions
This is a big one: never use a superuser or admin account for your CDC connection. It’s a security and operational nightmare waiting to happen. The best practice is to create a dedicated user with the absolute minimum permissions needed.
For instance, with PostgreSQL, you’d create a new user and grant it two specific things:
- The REPLICATION role. This is non-negotiable; it’s what allows the user to connect in replication mode and stream changes from the WAL.
- SELECT permissions on the tables you plan to capture. This is necessary so the tool can perform the initial data snapshot correctly.
Granting only these permissions ensures your CDC tool can do its job—and nothing more. It can read change logs and initial data, but it has no power to modify data or even see tables outside its scope.
Adjusting the Transaction Log Settings
Finally, you need to make sure your database’s transaction log holds onto changes long enough for your CDC process to grab them. This is your safety net. If the CDC process gets interrupted for any reason, this buffer ensures it can pick up right where it left off without any data loss.
What you need to configure depends on your database:
- In PostgreSQL, you’ll be looking at settings like
max_wal_sendersandwal_keep_segments. - In MySQL, this means setting
binlog_formattoROWand managingexpire_logs_days.
Tuning these parameters correctly makes your data pipeline resilient to network blips or brief downtime. For a much deeper dive on this, check out our complete guide to PostgreSQL change data capture. Properly configured logs are the foundation of a reliable CDC setup that you don’t have to constantly babysit.
Building Your First Real-Time Data Pipeline
Alright, your database is prepped and ready. Now for the fun part: watching the data start to flow. This is where you really see the power of a managed platform. What used to be a multi-week engineering headache can now be knocked out in an afternoon. Forget complex coding—we’re talking about a few simple clicks to get a production-ready pipeline running.
Let’s imagine a real-world use case. You have customer data in a production PostgreSQL database that needs to get into Snowflake for your analytics team. The end goal? A live dashboard that shows the sales team exactly what’s happening with customer accounts, as it happens.
Connecting to Your Source Database
First things first, you have to tell the system where the data is coming from. In a platform like Streamkap, you’ll kick this off by creating a new Source Connector. Just pick “PostgreSQL” from the list of options and plug in your connection details.
This is where the user you created earlier comes into play. You’ll need to provide:
- The database hostname and port
- Your database and schema names
- The username and password for that dedicated replication user
Once you hit connect, the platform does a quick handshake with your database. It’s not just checking credentials; it’s also verifying that the user permissions are correct and that logical replication is actually enabled. This is a huge time-saver, as it catches common setup mistakes right away instead of leaving you to debug a failing pipeline later.
Picking a Destination
With your source hooked up, you need to tell the data where to go. In our scenario, this means creating a Destination Connector for Snowflake. The process is pretty much the same: provide the credentials for your Snowflake account, including the account URL, warehouse, database, schema, and user info.
The platform uses this to establish a secure connection, making sure it can create the necessary tables and land the data. This simple form-fill exercise takes the place of manually configuring Snowflake drivers, wrestling with network policies, or writing custom data loading scripts.
Pro Tip: I always recommend creating a dedicated, limited-permission user in your destination warehouse specifically for your CDC tool. It’s a security best practice (hello, principle of least privilege) and helps keep everything tidy.
Firing Up the Pipeline
Now you connect the dots. You’ll create a new pipeline, selecting the PostgreSQL source and Snowflake destination you just configured. The moment you launch it, something really cool happens behind the scenes: the initial data snapshot begins.
The system performs a consistent, one-time read of all the existing data in the tables you’ve chosen to sync. But here’s the clever part: while that historical backfill is happening, it’s also already monitoring the PostgreSQL transaction log for any new changes.
This two-pronged approach is what makes modern CDC so reliable. You get a complete historical load without any data gaps, followed by a seamless switch to a live, continuous stream of events. The platform even inspects your source schemas and automatically creates perfectly matching tables in Snowflake.
If you want to get into the technical weeds of how this works, we cover it in our deep dive on SQL-based Change Data Capture.
Within just a few minutes, you’ll see your historical data populating in Snowflake. A moment later, every new insert, update, and delete from your source database will start appearing in near real-time. And just like that, you’ve built a robust, scalable data pipeline without writing a single line of code.
How to Validate and Monitor Your Data Flow
Alright, your pipeline is built and humming along. That’s a huge win, but the real work starts now: trusting the data it’s delivering. Getting that confidence in your new CDC setup is the final, and frankly, most important step. It’s all about having straightforward ways to check the data flow and simple tools to keep an eye on its health.
The best way to build that trust is to see it work for yourself.
Start with a quick manual check. It’s dead simple. Pick a record in your source database—one you know is already in the destination. Now, make a small, obvious change. Something like updating a customer’s email address or changing a status field.
Hop over to your destination warehouse and query that same record. You should see your change reflected almost instantly, usually within seconds. This little test gives you immediate, concrete proof that the entire stream is working end-to-end. It confirms changes aren’t just being captured but are landing where they should be, with next to no delay.
Using the Built-in Monitoring Tools
Manual checks are great for a spot-check, but you can’t be doing that all day. For long-term peace of mind, you need automated monitoring. This is where a managed platform like Streamkap really shines, as it provides this right out of the box. You don’t have to bolt on a separate, complicated observability stack. The tools are built to give you a clear view of your pipeline’s performance at a glance.
My Take: True simplicity in CDC isn’t just about a fast setup. It’s about having monitoring so tightly integrated that you can trust and manage your data streams without needing a dedicated team or a bunch of extra tools.
For each pipeline, you’ll find a dashboard that tracks the most important health metrics. From my experience, these are the ones to watch:
- End-to-End Latency: This is the big one. It measures the total time it takes for a change to get from the source database log all the way to your destination. A healthy pipeline should keep this consistently low, well under a minute.
- Data Throughput: This shows you the volume of data your pipeline is crunching, often in events or rows per second. Watching for spikes or sudden drops can help you understand how your application’s activity impacts the data flow.
- Connector Status: Look for the simple green light. It’s a quick, visual confirmation that every piece of the puzzle is online and operational.
Set Up Proactive Alerts
Dashboards are great, but you can’t stare at them 24/7. This is where proactive alerting becomes your safety net.
You can set up alerts to ping you on Slack, email, or whatever your team uses if something looks off. For example, you could trigger an alert if latency creeps past five minutes or if the pipeline throws an error. This approach moves you from being reactive to proactive. You’ll know about a problem long before it ever impacts your downstream users.
By focusing on cloud-based solutions that offer this kind of built-in monitoring and scalability, teams can gain real-time insights and lean on AI-powered features for greater automation. Discover more about the CDC tools market to see where the industry is heading.
How a Modern CDC Platform Solves Problems for You
True simplicity in Change Data Capture isn’t just about a slick setup wizard. It’s about what happens after you go live—when the inevitable, real-world problems start to pop up. A genuinely low-overhead solution anticipates these headaches and deals with them automatically. If it doesn’t, you’ve just swapped one set of data problems for another.
Plenty of teams discover this the hard way. They get a pipeline up and running, and things look great for a while. Then, a developer on the application team adds a new column to a source table. With a traditional setup, that one tiny change can shatter the entire data flow, setting off late-night pager alerts and forcing someone to manually patch the downstream schema.
Automatic Schema Evolution
This is where a managed platform like Streamkap completely changes the game. Instead of the pipeline breaking, it spots the schema change in the source database and just… handles it. The change is intelligently propagated all the way to your destination, with zero human intervention.
Think about this everyday scenario:
- An engineer adds a
last_login_ipcolumn to youruserstable in PostgreSQL. - Streamkap’s log-based CDC connector instantly picks up this
ALTER TABLEevent from the database logs. - It then automatically runs the right command to add the new column in your Snowflake or BigQuery destination.
- The data stream just keeps flowing, now including data for that new column. No drama, no downtime.
This one feature alone solves one of the most persistent pains in data engineering. Your pipelines become resilient to application updates, which means your development and data teams can finally work without constantly tripping over each other.
A pipeline that can’t handle schema changes isn’t a pipeline; it’s a liability. Automated schema evolution is non-negotiable for low-complexity CDC because it lets your data flow adapt to your business, not hold it back.
Guaranteeing Your Data Is Correct
Another huge challenge is keeping data consistent across different systems. What happens if a network glitch causes a message to be sent twice? How do you make sure you don’t lose or duplicate data? A managed platform solves this by enforcing exactly-once processing guarantees.
This is a critical promise: every single change event from your source is processed and lands in your destination exactly one time. It doesn’t matter what failures happen along the way. This is a massive improvement over “at-least-once” delivery, which can litter your analytics with duplicate records and force you to write tedious cleanup scripts to fix the mess.
Handling All Your Weird and Wonderful Data Types
Databases are messy. They’re filled with a whole spectrum of data types, from simple integers and text to complex nested JSON objects and geospatial data. A truly simple CDC tool has to handle this diversity out of the box, without making you write custom code for each new type you encounter.
For example, a platform like Streamkap just gets it. It automatically understands and correctly maps data types like:
- JSONB in PostgreSQL becomes a
VARIANTorJSONtype in your data warehouse. - Geospatial data, like PostGIS types, is translated into a compatible format.
- Timestamps with time zones are preserved perfectly across systems, avoiding frustrating conversion errors.
This seamless type handling ensures the data landing in your destination is a perfect, query-ready mirror of what’s in the source. By automatically managing schema drift, guaranteeing data integrity, and translating complex data types, a modern CDC platform removes the hidden landmines that so often derail data projects. What you’re left with is a solution that actually works with minimal maintenance.
Common Questions About Implementing CDC
When teams start looking at Change Data Capture, a few practical questions always come up. Here are the answers to the ones we hear most often, digging into the real-world concerns you’ll face after the initial setup.
What’s The Real Performance Hit on My Database?
This is probably the most common (and important) question we get. The good news is that modern, log-based CDC is built from the ground up to be incredibly lightweight.
Unlike old-school methods that hammered your database with constant queries, this approach just passively reads the transaction log—think of it as reading a journal of what the database has already done. For PostgreSQL, this is the WAL, and for MySQL, it’s the Binlog.
Because the CDC process isn’t competing for resources with your application’s actual read and write operations, the impact is minimal. We typically see an overhead of less than 2-5% CPU utilization, which is perfectly safe for even the most high-traffic production databases.
The beauty of log-based CDC is that it captures every single event, in the right order, and in real time—all without bogging down your source database. It’s the gold standard for a reason.
How Do You Handle The Initial Data Load?
Getting all your existing historical data synced up used to be a massive headache. You’d have to perform a huge data dump and then carefully try to start the stream from the exact right point without missing or duplicating data.
Modern CDC platforms like Streamkap have completely automated this. When you set up a new pipeline, the platform handles the initial snapshot for you.
It starts by taking a consistent, one-time read of all the data in the tables you’ve selected. But here’s the clever part: while that snapshot is running, it’s also keeping track of all the new changes happening in real time. Once the snapshot is done, it just switches over to the live stream. This guarantees a smooth transition with absolutely no data gaps.
Can I Reshape Data Before It Lands in the Warehouse?
Yes, and this is a huge architectural win. The best platforms let you perform transformations while the data is in flight, which can save you from needing a whole separate transformation step later on.
Instead of just dumping raw data and cleaning it up in your warehouse (which costs time and compute), you can handle a lot of it right inside the pipeline. For example, with Streamkap, you can easily:
- Mask sensitive PII before it ever leaves your own environment.
- Drop or rename columns to fit the schema in your destination.
- Adjust data types to avoid compatibility issues down the line.
You can usually configure these rules in a simple UI, letting you send clean, ready-to-use data directly to your destination.
Ready to see how simple Change Data Capture can be? Find out how Streamkap gets real-time data pipelines running in minutes, not months. Start your free trial today.
Related resources
Kafka Consumer Lag: Causes, Debugging, and Fixes
Consumer lag is the most common Kafka operational issue. Learn what causes it, how to measure it, and practical strategies to bring it under control.
Kafka on Kubernetes: Real-World Lessons
Running Kafka on Kubernetes sounds like a good idea until you hit storage, networking, and operational challenges. Here's what teams learn the hard way and how to avoid the common pitfalls.
Backpressure in Stream Processing: What It Is and How to Handle It
Learn what backpressure means in streaming pipelines, how to detect it, and practical strategies for handling it in Kafka, Flink, and CDC pipelines without losing data.