Real-Time Data Pipeline Example With Streamkap

Discover how to build a complete real-time data pipeline example with Streamkap for ingestion, CDC, transformation, and delivery. Step-by-step guide.
You can actually watch raw events flow from ingestion to activation in milliseconds. It’s a simple demo that packs a punch—showing how instant processing drives on-the-spot insights and automated actions.
Understanding Real-Time Data Pipeline Basics
Picture an ecommerce site that only syncs orders at midnight—missing a payment hiccup would be a disaster. With a live pipeline, every purchase kicks off fraud checks and stock updates immediately.
Real-time pipelines shrink the gap between data arriving and decisions happening. Streamkap steps in to manage event streaming, Change Data Capture, and messaging behind the scenes.
Key Benefits Of Real-Time Pipelines Include:
- Live inventory updates to stop overselling during flash sales
- Instant fraud alerts that block suspicious transactions
- Near-zero latency thanks to CDC and fine-tuned buffers
The diagram below breaks down the three main stages: ingest, stream, act.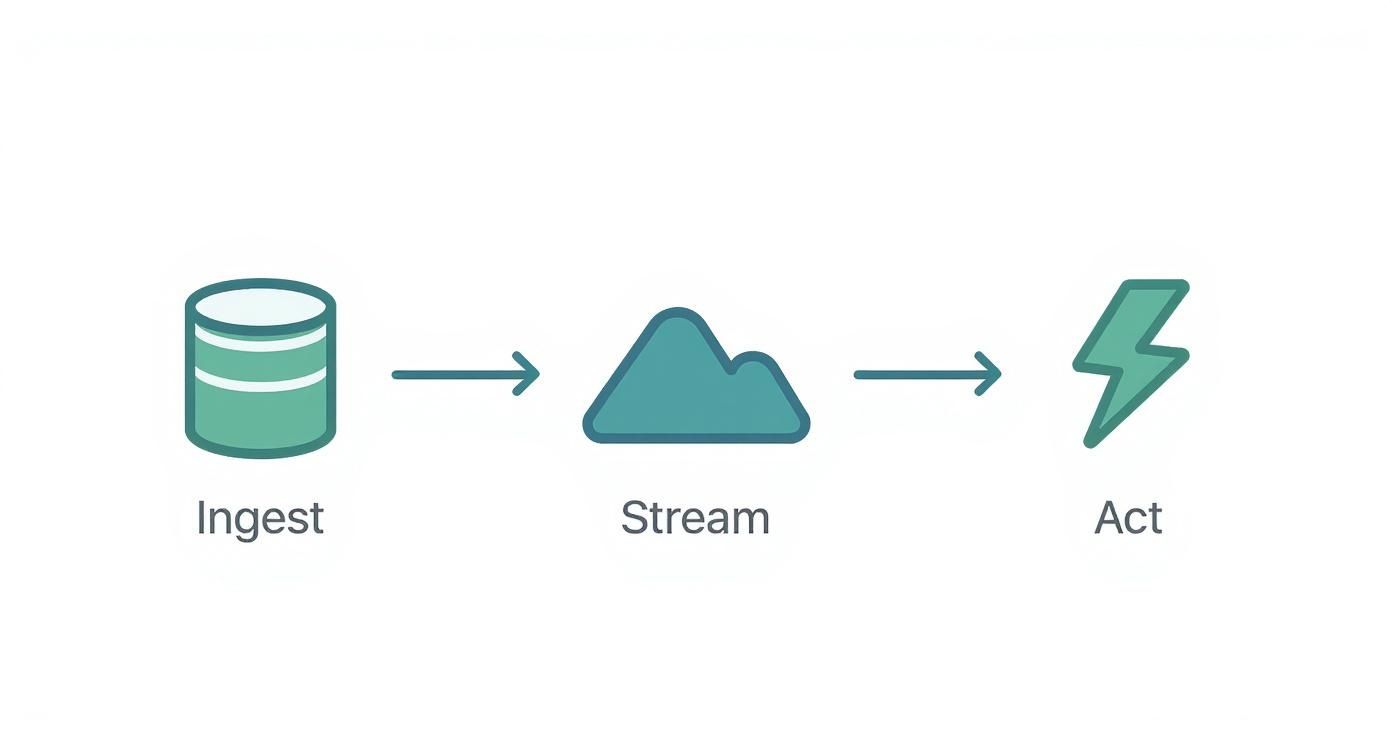
This flow shows how ingestors queue raw events, streamers move data reliably, and actors apply your business logic without delay.
Core Components Of Real-Time Pipelines
Event streaming keeps a constant feed from sources like application logs or market feeds, while CDC watches for row-level changes in your database with minimal overhead.
Getting everything talking smoothly means:
- Configuring secure credentials
- Defining data formats (JSON, Avro, etc.)
- Tweaking network settings for fast, reliable transfers
“Real-time pipelines turn raw events into action within milliseconds, transforming business agility.” — Senior Data Engineer
You can spin up development environments locally with Docker or go full-cloud.
The global data pipeline tools market soared to USD 5.75 billion in 2023 and is on track to hit USD 18.93 billion by 2033, at a 12.7% CAGR. Learn more about these market findings on DataHorizzon https://datahorizzonresearch.com/data-pipeline-tools-market-45518.
Real-time data pipelines power everything from live analytics dashboards to real-time stock scanning applications in the finance world.
Check out our guide on real-time data streaming to explore deeper implementation details.
Let’s dive in.
Initial Streamkap Setup
Begin by signing up at Streamkap.com with your business email and a strong password. Once your account is live, you’ll install the CLI on macOS, Linux, or Windows.
- Run
npm install -g streamkap-clito add the CLI globally. - Or launch it in Docker with
docker run --rm -it streamkap/cli. - Securely export your API key via
export SK_API_KEYinstead of embedding it in your code.
Rely on environment variables for credentials and stash secrets in a vault—AWS Secrets Manager works nicely. Rotate keys every quarter and enforce least-privilege roles to keep everything locked down.
Organize Your Workspace
A logical folder structure pays off as your pipeline grows. Group connections, transformations, and sinks in distinct directories. Consistent naming prevents confusion when you scale.
- 🚀
src-sourcesholds initial connector scripts - 🔄
src-transformsis where SQL or JavaScript mappings live - 📦
src-sinkskeeps your delivery configs
“Always isolate credentials in environment variables and never commit them to git for maximum security.”
Connect Your Data Source
Pick your source—PostgreSQL or S3—and wire it up with a single command.
- For PostgreSQL:
streamkap source create pg-sample --type postgres --host $PG_HOST --port $PG_PORT --username $PG_USER --password $PG_PASS --database salesdb - For an S3 bucket:
First runaws configureto set AWS keys, thenstreamkap source create s3-logs --type s3 --bucket my-logs --region us-east-1
Verify connectivity with streamkap source test pg-sample; a 2XX response means you’re ready for change-data capture. Label each source—like prod-pg-sales or dev-s3-logs—to keep environments tidy.
Validate Setup
A quick streamkap status reveals active sources and their health metrics. Track latency and error rates straight from the CLI dashboard.
- Use
--retries 5to ensure up to 5 automatic retries - Set
--timeout 30sfor operations that take longer - Tag sources with
env=devorenv=prodfor faster filtering - Add
team=analyticsor similar tags to simplify audits
Next Steps
With your source live, it’s time to enable CDC and fine-tune polling intervals. A short poll window guarantees near real-time updates.
- Adjust
--poll-intervalto 200ms for sub-second freshness - Refine your backoff strategy to balance retries and throughput
Tip: Apply consistent naming conventions to streamline UI filters. Centralize logs for deep-dives into connection history and troubleshoot on the fly. Verify permissions before every connectivity test to avoid surprises.
Setting Up Change Data Capture
Change Data Capture brings near-real-time updates to our pipeline, capturing every insert, update, and delete as it happens. In this example, we’ll walk through enabling CDC on your source database and fine-tuning Streamkap to keep latency under 500ms.
In a live environment, factors like polling frequency, snapshot size, and continuous streams determine how snappy your pipeline feels. Coordinating CDC with schema changes also prevents data gaps—monitor change logs, replication slots, and DDL events closely.
Key Configuration Items
- Tweak poll intervals to 200ms for sub-second freshness
- Sequence your initial snapshot alongside live change streams without downtime
- Coordinate schema migrations so no events slip through
- Track lag and throughput via built-in Streamkap metrics
Tuning Polling Intervals
A 200ms poll interval often brings end-to-end latency below 500ms. If your system faces transient errors, backoff strategies smooth retries without hammering the source.
- On the command line, run
streamkap cdc create my-cdc --source prod-pg --poll-interval 200ms --slot replication_slot --publication my_pub
Managing Snapshot And Change Streams
Pulling millions of rows in one go can overwhelm any connector. Split the snapshot into logical batches or apply table filters so core tables go first, followed by incremental updates on the rest.
Before we dive deeper, let’s compare classic batch jobs with CDC for real-time needs:
Comparison Of Batch And CDC Approaches
The table below highlights how batch processing stacks up against continuous, row-level change capture.
Both methods have their place—batch suits historical analytics, while CDC shines in operational dashboards and alerting systems.
Avoiding Data Loss During Migrations
Schema changes can interrupt CDC if applied on the fly. A simple ritual keeps your stream intact:
- Pause downstream consumers
- Apply DDL changes on the source
- Resume CDC once the new schema is live
“Pause, migrate, and resume CDC to protect your pipelines during schema changes”
— Data Engineering Lead
For instance, a payments team once paused their CDC feed, updated customer profile tables, then resumed the stream seamlessly—no downtime, no missing records.
Check out our guide on Change Data Capture fundamentals to deepen your understanding before getting started.
Validating CDC Health
Early detection of hiccups keeps your pipeline robust. Watch lag, error rates, and slot usage from the Streamkap dashboard.
- Monitor commit_lsn lag per replication slot
- Trigger alerts when lag exceeds 5s or error counts spike
- Schedule monthly cleanup of stale replication slots
- Review throughput and latency trends weekly
A quick snapshot comparison after migrations confirms your streams are accurate and on track. With CDC configured and validated, you’re ready to route, transform, and deliver real-time data without compromise.
Designing Transformations And Routing
When change events arrive in Streamkap, that’s your cue to refine and direct them. You decide which fields matter, enrich missing values, and split the stream into multiple targets without extra code. This flexibility is the cornerstone of a resilient real-time pipeline.
Imagine stripping out internal audit columns before a BI dashboard consumes the data. At the same time, a geo-IP lookup enriches clickstream records so location insights stay accurate.
Writing Filter Rules And Enriching
I typically kick off transformations with the SQL-like transformation engine. It reads like familiar SQL, yet runs in real time. You can recast strings into integers, trim excess whitespace, and derive custom metrics on the fly.
For example:
SELECT
user_id,
event_time,
IFNULL(session_id,'unknown') AS session_id
FROM
raw_events
WHERE
status='active';
This snippet weeds out inactive sessions and fills any blank session IDs. Beyond filters, you can join lookup tables—maybe a product catalog—to attach pricing tiers or regional flags before the data moves downstream.
Routing Streams To Topics Or Tables
Once your events are shaped, set up routing rules that match business priorities. Send urgent fraud alerts to an alerts topic, then funnel high-volume logs into a logs_archive table for later analysis.
Here are a few tried-and-true suggestions:
- Label events with
env=prodorenv=devso you can quickly toggle between environments. - Adopt clear naming conventions like
topic_user_clicksortable_order_events. - Keep an eye on throughput and consumer lag metrics to spot potential chokepoints early.
Idempotent operations ensure that replayed transformations produce the same output every time, protecting you from duplicates when retrying.
For out-of-order or delayed clickstream events, sliding windows come to the rescue. A rolling five-minute window helps consolidate events into coherent user sessions.
Packaging And Deployment
Next, wrap your SQL scripts in a Docker container. This not only locks in dependencies but also makes version control and testing straightforward. I often start with a Dockerfile similar to this:
FROM node:14
COPY transforms.sql /app/transforms.sql
CMD ["streamkap","transform","apply","/app/transforms.sql"]
Push the built image to your container registry, then let your CI pipeline handle automated testing. A consistent runtime across development, staging, and production environments drastically cuts down on unexpected issues.
Below is a preview of Streamkap’s transformation editor, highlighting filter rules and enrichment steps:
You can interactively tweak your scripts and see sample outputs before hitting “apply.”
The broader market for data pipeline tools is booming. It’s expected to hit USD 14.76 billion in 2025, growing at a 26.8% CAGR through 2030 and reaching nearly USD 48.33 billion by then. Learn more about data pipeline tools market findings
Testing And Validation
Before promoting to production, I recommend generating synthetic events that cover every edge case. Build unit tests to validate type conversions, conditional logic, and timestamp boundaries.
Then, add quick end-to-end smoke tests in your CI process:
- Confirm important fields aren’t dropped unintentionally.
- Verify streams land in the correct topic or table.
- Check idempotency by replaying the same event batch.
In one retail implementation, these practices slashed deployment failures by 70%. By versioning each Docker image and running tests before every rollout, the team maintained rock-solid stability.
Mastering these transformations and routing patterns lets your data team act on fresh insights without waiting. Plus, versioned containers and monitoring hooks give you end-to-end visibility, making audits and rollbacks virtually painless. Next up, we’ll look at delivering these refined events into various target systems, rounding out your real-time data workflow.
Delivering Data To Target Systems
Once your transformations finish, events glide straight into the destinations you’ve set up. Whether you’re firing data into a cloud warehouse or pushing docs into a NoSQL collection, each sink needs its own fine-tuning.
You’ll tackle things like field mappings, batch sizes, compression schemes and those essential delivery guarantees. In real-world pipelines, exactly-once or at-least-once delivery modes can make or break your SLAs.
Here’s a quick look at common targets:
- Cloud Warehouses for high-volume analytics and reporting
- NoSQL Stores when your schema might shift over time
- Message Queues to decouple event producers and consumers
- Search Indexes powering full-text queries and live dashboards
Configuring Sink Options
Batch size sits at the heart of your throughput-versus-latency tradeoff. Push more records per batch and you’ll see higher throughput, but you’ll also introduce a bit more lag. Dial it down and you reduce delays at the cost of some throughput.
Compression is another lever worth pulling. Both gzip and Snappy will shrink your payloads—but gzip often wins on compression ratio, cutting data by 60% on average without blowing up CPU.
Deciding between at-least-once and exactly-once delivery depends on your tolerance for duplicates:
- At-Least-Once: Retries until you get a success. Perfect for high-volume log streams where a rare duplicate is harmless.
- Exactly-Once: Enforces idempotent writes or two-phase commits. Ideal when duplicates could corrupt downstream analytics.
Align these settings with your key SLAs. For example, ingesting raw clickstreams might be happiest in an at-least-once mode to avoid bottlenecks, while financial transactions often demand that rigorous exactly-once promise.
Target System Comparison
Below is a side-by-side of popular sink types and how they stack up:
This overview should help you pick the best sink based on your latency and throughput needs.
Routing And Error Handling
Sometimes you need the same event in two different places. Dynamic routing lets you split streams by content—using JSON pattern matching or SQL-like filters—to fan events out to multiple topics or tables.
Malformed records? Dead-letter queues are your safety net. They catch bad payloads without stalling the main flow, giving your team a chance to fix issues offline.
- Tag events with metadata so each sink can filter efficiently
- Set fallback rules to direct unexpected payloads into dead-letter storage
- Keep an eye on dead-letter queue depth—spikes often signal schema drifts or integration bugs
Monitoring and alerts keep you on top of error rates. For instance, you might trigger an alert if failures cross the 1% threshold.
Key takeaway: gzip compression often slashes payload size by 60% while still loading data in under a second.
Learn more about streaming with CDC into BigQuery in our guide on BigQuery integration.
Validating Your Sink Configuration
Before you hit production, run a quick sanity check in a sandbox:
- Confirm field names align with your destination schema
- Verify data types match target columns
- Inject a few malformed records to test dead-letter routing
- Measure end-to-end latency with synthetic events
This exercise surfaces mapping glitches and performance bottlenecks early. Plus, you can fine-tune thresholds or add throttling rules before anyone notices.
With these configurations locked in, your pipeline will meet performance targets without compromising data fidelity. Next up, we’ll dive into troubleshooting techniques to keep your streams flowing smoothly over time.
Troubleshooting And Optimization Tips
Even seasoned teams hit snags when schema drift or connector timeouts pop up in a real-time pipeline. I’ve found that getting eyes on your data flow—right when issues emerge—makes all the difference.
Streamkap’s metrics dashboards, automated alerts, and centralized logs become your first line of defense. They help you spot failures or lag before downstream services start complaining.
- Track Ingestion Rates and Error Counts to spot regressions at a glance
- Configure Alert Thresholds on retry rates or latency spikes for instant notifications
- Centralize Connector Logs in one place to speed up root-cause analysis
- Compare Schemas Automatically before each sync to catch drift early
I once saw a tiny column change in a source table bring ingestion to a screeching halt. Thanks to automated schema checks, we caught that mismatch in under five minutes—no downstream headaches.
Tuning And Scaling Strategies
Small tweaks can shave seconds off your end-to-end latency. For example, cutting batch sizes in half often reduces memory spikes, though you might see more frequent requests.
Tip: Scale worker nodes automatically when CPU usage tops 70%. It’s saved us from scrambling during traffic surges.
In multi-cloud deployments, adding extra workers keeps throughput steady under unexpected loads. Streamkap’s autoscaler handles node provisioning across AWS, GCP, or Azure without you lifting a finger.
Safe retry logic is critical, too. You want to avoid endless loops if a connector hiccups. Likewise, rolling out schema changes incrementally—zero-downtime migrations, anyone?—lets you deploy updates without interrupting service.
Key Takeaway: Observability solutions are on track to expand from USD 912 million in 2025 to USD 2.52 billion by 2035 at a 10.7% CAGR. Learn more about this segment on Future Market Insights.
Frequently Asked Questions
When you’re wiring up a real-time data pipeline with Streamkap, engineers tend to circle back to a handful of key concerns. Below are the four we hear most often and how they play out in practice.
What Data Sources Does Streamkap Support?
Streamkap comes ready to tap into PostgreSQL, MySQL, SQL Server, Amazon S3 and Google Cloud Storage. It also reads from Apache Kafka topics and major NoSQL stores. If your source is one-off, the connector SDK makes a custom integration straightforward.What Latency Can I Expect?
With Change Data Capture trimmed down and minimal batching, we routinely clock 500 ms or less. Even in heavy-load scenarios, you’ll typically see end-to-end delays between 500 ms and 2 s, depending on network conditions and throughput.How Do I Handle Schema Evolution?
Streamkap’s CDC engine detects structure changes and applies migrations on the fly—no service interruptions. Custom mapping rules let you rename fields, adjust data types or update nested JSON without skipping a beat.What Are the Cost Considerations?
Your monthly bill reflects data volume, the number of connectors and your deployment choice (cloud versus self-hosted). Pay-as-you-go plans and volume discounts simplify forecasting compute, storage and egress fees.
Additional Clarifications
“With Streamkap’s CDC-driven migrations, you don’t have to schedule downtime for schema updates,” notes a senior engineer who’s overseen multiple large deployments.
Before you push changes live, run the streamkap health-check from the CLI. Catching misconfigurations early keeps replication humming.
For elaborate environments—think multi-region or hybrid cloud—our docs offer deep dives. You can also tap into our community Slack channel, where engineers share quick tips and real-world fixes.
These insights come from teams running Streamkap at scale, and they’ll help you avoid surprises around performance, maintenance and cost as you build your pipeline.
Quick Summary
- Data Sources: Connect PostgreSQL, MySQL, SQL Server, S3, GCS or craft your own via the SDK.
- Performance: From 500 ms down to sub-500 ms in finely tuned setups; expect 500 ms–2 s in production.
- Schema Evolution: CDC-driven migrations and custom mappings, no downtime required.
- Pricing Model: Predictable pay-as-you-go tiers with volume discounts covering compute, storage and egress.
Start your real-time data pipeline example with Streamkap today https://streamkap.com

Related blog posts