A Guide to Change Data Capture Postgres
Master change data capture Postgres with our practical guide. Learn to stream real-time data from your database using logical replication and modern CDC tools.
Forget slow, nightly batch jobs. If your applications are still waiting for data, you're already behind. The modern standard is instant data, and PostgreSQL's Change Data Capture (CDC) is how you get there. It’s a powerful technique for capturing every single INSERT, UPDATE, and DELETE the moment it happens, effectively turning your database into a live stream of events.
Why You Need Real-Time Data from Postgres
For years, the data world ran on batch ETL jobs that chugged along overnight. That model is broken. Today's businesses need to power interactive dashboards, keep microservices in lockstep, and deliver highly personalized user experiences. Waiting 24 hours for a data refresh is like trying to drive while looking in the rearview mirror—it’s a massive competitive disadvantage.
The move to real-time processing isn't just a trend; it's a fundamental shift. We're seeing a huge uptick in the adoption of CDC technologies, all driven by this urgent need for instant data. In fact, the CDC market is projected to grow at a Compound Annual Growth Rate of around 20.1% between 2023 and 2030. You can read more about what's driving this accelerated adoption of PostgreSQL here: https://streamkap.com/blog/change-data-capture-for-streaming-etl.
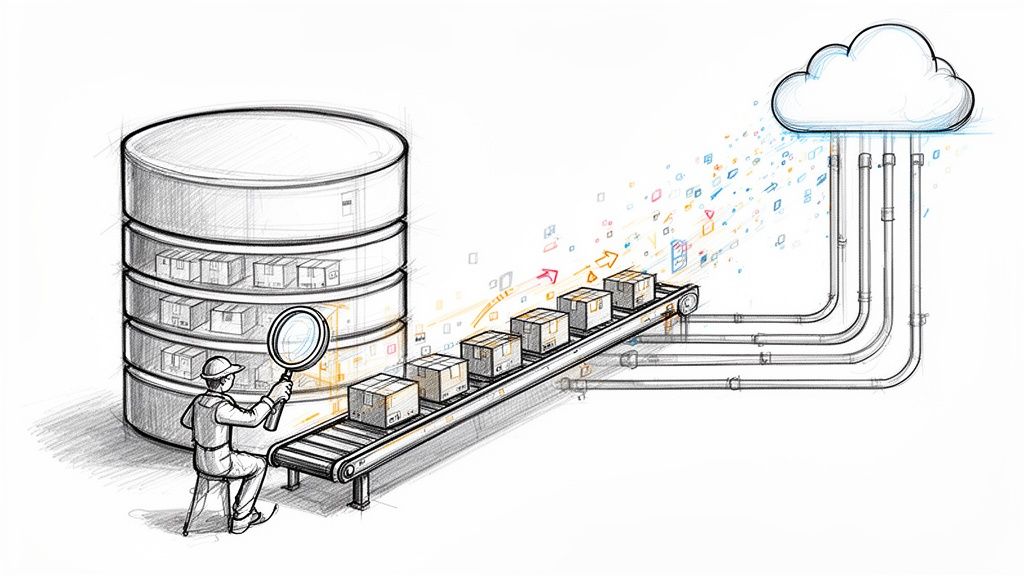
Tapping into the Data Stream
So, how does it work? PostgreSQL has a fantastic built-in feature called logical decoding. This lets us tap directly into the database’s transaction log (known as the Write-Ahead Log, or WAL) without hammering the database with constant queries or messy triggers. It's a clean, low-overhead way to get the data you need.
This image from the official PostgreSQL site underscores its well-earned reputation as a powerful and reliable open-source database—the very foundation you need for a solid CDC pipeline.

This reliability is non-negotiable. When you implement CDC, your database becomes the central nervous system for your entire data architecture.
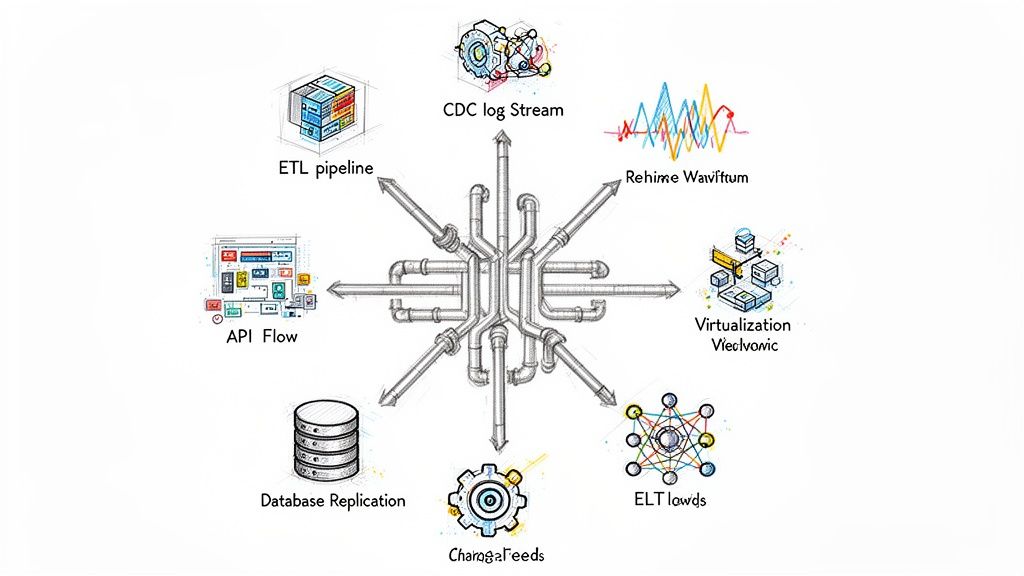
What You Can Build with Postgres CDC
The benefits of PostgreSQL CDC aren't just abstract concepts; they solve real, everyday business problems. From my own experience, here are a few places where it shines:
- Live Analytics Dashboards: Imagine your sales or inventory dashboard updating not just daily, but every few milliseconds. That's what CDC enables.
- Microservices Synchronization: You can finally kill off data silos. Let your different services subscribe to data changes from a single source-of-truth Postgres database to stay perfectly in sync.
- Instant Cache Invalidation: Automatically purge or update records in a cache like Redis the exact moment the source data changes in Postgres. No more stale data.
By streaming changes directly from the source, you guarantee data consistency across your entire tech stack. This is the bedrock of modern, event-driven systems and a huge leap forward from fragile, point-to-point integrations.
The insights you get from CDC are the fuel for broader real-time data analytics, which is absolutely critical for making sharp, timely business decisions.
Preparing Your Postgres Database for CDC
Before you can stream a single change, you need to get your PostgreSQL database ready. This isn't just a suggestion—it's the absolute foundation for a stable Change Data Capture pipeline. We'll walk through the essential tweaks you'll need to make in your postgresql.conf file to get logical replication up and running.
Getting these settings right from the outset saves you from a world of hurt later on. It’s like pouring the foundation before building a house; you just don't skip it. Having a good handle on general database design best practices also goes a long way in making your CDC setup smoother and keeping your data clean.
Configuring the WAL Level
First things first, let's talk about the single most important parameter: wal_level. Out of the box, Postgres sets this to replica. That’s fine for physical replication, but it just doesn't have the rich detail we need for CDC.
To get the ball rolling, you have to change this setting to wal_level = logical. This crucial change tells Postgres to pack more information into its Write-Ahead Log (WAL), which CDC tools can then interpret as a stream of row-level changes. Without this, your CDC plans are dead in the water.
Keep in mind, this change requires a full database restart. It's a bit of planned downtime, but it's a small price to pay for the power of real-time data.
Setting Up Replication Connections
Next up, you need to let your CDC tools actually connect and pull that WAL stream. Two key parameters govern this access: max_wal_senders and max_replication_slots.
max_wal_senders: This determines how many concurrent connections can stream replication data. Every CDC connector or replica you run will use one of these slots.max_replication_slots: This setting controls the number of replication slots you can have. Think of a slot as a durable bookmark for your data consumer, making sure it never loses its place or misses data, even if it temporarily disconnects.
Pro Tip: I've seen it happen time and again—people set these values too low and then wonder why things are breaking. For a production setup, a safe bet is to set both max_wal_senders and max_replication_slots to at least 10. This gives you plenty of breathing room for your CDC connectors and any other physical replicas you might be using.
This infographic lays out the core configuration changes visually.
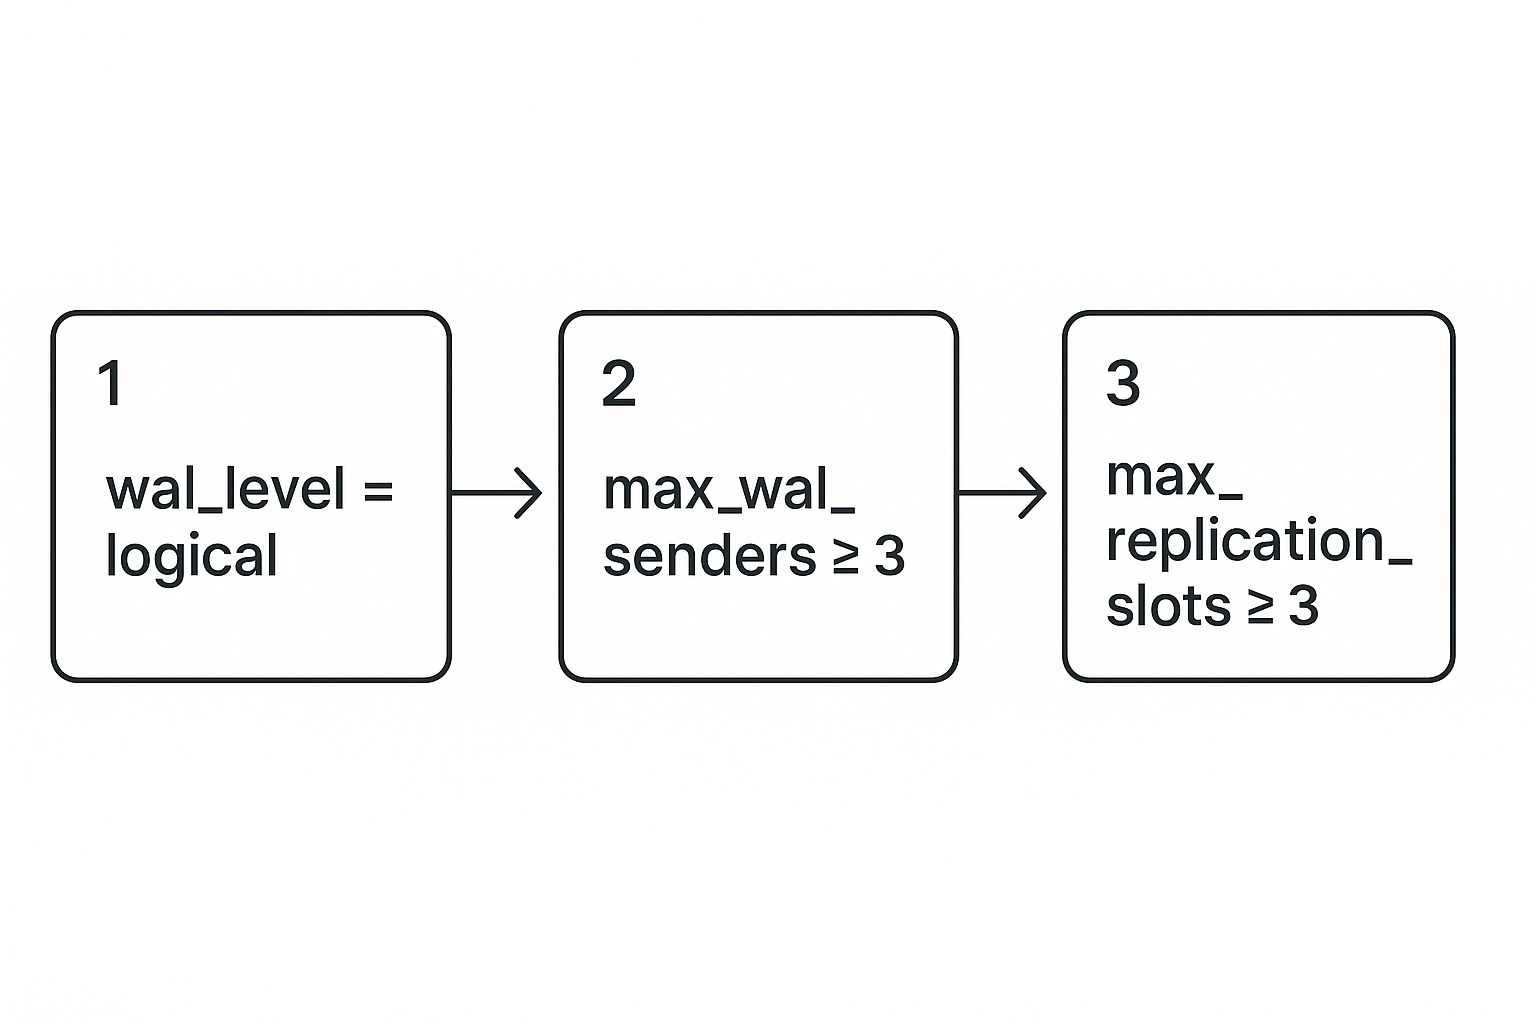
This simple flow chart really drives home the non-negotiable settings you need for a solid CDC pipeline from your PostgreSQL database.
Once you’ve updated your postgresql.conf file, don't forget the final step: restart the PostgreSQL server. After it’s back up, you can pop into a psql session and run SHOW wal_level; to double-check your work. You should see logical returned, which is your green light for CDC.
If you're dealing with more advanced scenarios, like a multi-tenant architecture, check out our deep-dive guide on PostgreSQL CDC in multi-tenant environments.
Making Sense of Logical Replication and Replication Slots
Now that your database is configured, we can get into the two core concepts that really make PostgreSQL CDC tick: logical decoding and replication slots. These aren't just obscure database terms; they are the engine and the safety harness for your entire data pipeline. Getting a solid grasp on how they work together is key to building something you can trust.
Think of logical decoding as your database's built-in translator. It taps into the raw, binary transaction log—the Write-Ahead Log (WAL)—and transforms it into a clean, easy-to-understand stream of change events. Every INSERT, UPDATE, and DELETE is captured and formatted, giving your downstream systems the exact information they need, right when it happens.
This log-based approach is incredibly efficient. Instead of constantly polling the database with queries, CDC platforms read the transaction log directly, which means zero overhead on your production tables. This is a huge win for performance and ensures you maintain perfect transactional consistency. As businesses increasingly depend on real-time data, this method has become standard practice. For more on this trend, check out this detailed analysis on CDC adoption trends.
The Critical Role of Replication Slots
If logical decoding is the engine, then a replication slot is the system's safety net. In simple terms, a replication slot is a persistent bookmark. It tells PostgreSQL exactly which WAL transactions have been successfully sent to a consumer, like Streamkap.
Why is this so important? Without a replication slot, PostgreSQL has no idea if a consumer has processed the WAL files and will eventually clean them up to save space. If your CDC connector goes offline for maintenance or a network blip, it could come back online to find the transaction history it needs has vanished. That means permanent data loss.
A replication slot guarantees that all WAL files are retained until the consumer confirms they've been processed. This is how you achieve the "exactly-once" delivery that production systems demand. It ensures that even after an outage, your pipeline can pick up right where it left off, with no gaps.
Creating and Managing Your Slots
Getting a replication slot set up is pretty straightforward. You just need to connect to your database and run a single SQL command, defining two key things:
- Slot Name: A unique name for your connector to identify itself (e.g.,
streamkap_slot). - Output Plugin: This is the specific "translator" that formats the WAL data. For most modern use cases, PostgreSQL’s built-in
pgoutputis the way to go, but others likewal2jsonare also available.
So, to create a slot named inventory_cdc_slot using the pgoutput plugin, the command looks like this:
SELECT pg_create_logical_replication_slot('inventory_cdc_slot', 'pgoutput');
Once a slot is live, you absolutely have to monitor it. The pg_replication_slots view is your go-to tool here. It shows you if the slot is active and, crucially, how much data (known as replication lag) is waiting to be consumed.
An inactive slot with a growing lag is a red flag. It means WAL files are piling up on your primary database, which can quickly chew through your disk space and bring everything to a grinding halt. Make monitoring this view a routine part of your operational checklist.
Connecting a CDC Tool to Your Database
Alright, you've got PostgreSQL prepped and ready for logical replication. Now for the fun part: connecting a Change Data Capture tool to actually start streaming those data events. This is where the rubber meets the road, bridging the gap between your database configuration and a live feed of every INSERT, UPDATE, and DELETE.
To keep things practical, we'll use examples based on a popular tool in this space, Debezium. The core of this process is creating a "connector," which is just a fancy term for a configuration file that tells your CDC platform how to talk to Postgres. It covers everything from login credentials to the specific tables you want to watch.
Given that PostgreSQL is now used by 49% of developers, according to Stack Overflow’s 2024 survey, mastering this integration is a massive advantage. Its reign as the most popular database for the second year running means that a solid CDC setup is more critical than ever for modern data pipelines. For a deeper dive into Postgres's growing popularity, you can read more on yugabyte.com.
Getting the Initial Connector Configuration Right
The first thing any connector needs to know is how to find and log into your database. Think of it as the foundation. You'll have to provide the basics: hostname, port, user, and password. It's absolutely critical that the user you specify here is the one you granted the REPLICATION privilege to earlier.
Here’s what a bare-bones configuration snippet looks like to get you started:
{
"name": "postgres-inventory-connector",
"config": {
"connector.class": "io.debezium.connector.postgresql.PostgresConnector",
"database.hostname": "your-postgres-host",
"database.port": "5432",
"database.user": "cdc_user",
"database.password": "your_secure_password",
"database.dbname": "inventory_db",
"database.server.name": "production-inventory"
}
}
This configuration establishes the handshake, but it doesn't actually tell the connector what to capture or how. That’s our next step.
Specifying What and How to Capture
Now we get into the details. You need to point the connector to the exact replication slot and publication you created. This is also where you decide how to handle all the data that already exists in your tables—the initial snapshot.
slot.name: This has to be an exact match for the logical replication slot you made, likeinventory_cdc_slot.publication.name: This points to the publication that contains the tables you want to stream.table.include.list: A simple comma-separated list of the tables you're interested in (e.g.,public.products,public.orders).snapshot.mode: This one is important. It tells the connector how to deal with existing data. A common choice isinitial, which performs a complete scan of the tables first, then switches to streaming new changes.
With these settings added, your configuration starts to look much more complete and focused on the job at hand.
Be careful with snapshot.mode. For massive tables, an initial snapshot can slam your database with a heavy load. If you only need changes from this moment on, consider using never. For a more controlled approach, you could even explore an option like exported to handle the snapshot offline.
Fine-Tuning Your CDC Behavior
Once you've got the basics down, you'll want to fine-tune a few other parameters, especially for a production environment. Getting these right can save you a lot of headaches and optimize performance down the line.
A key setting to look at is publication.autocreate.mode. By default, it's set to all_tables, which lets Debezium create a publication for every table in the database. That's often way too broad. Switching it to filtered is a much safer bet, as it ensures the publication only includes the tables you specified in your table.include.list. This gives you precise control.
Another one I always pay attention to is tombstones.on.delete. When a row is deleted in Postgres, this setting (enabled by default) tells the connector to send two messages: a special "tombstone" message with a null value and another with the final state of the deleted row. This is incredibly important for downstream systems like Kafka, as it allows them to properly handle log compaction and purge deleted keys. If you turn this off, you risk having stale data hanging around in your topics forever.
By carefully configuring these kinds of parameters, you’ll elevate your setup from a simple proof-of-concept to a robust and reliable change data capture postgres pipeline.
How to Test and Validate Your CDC Pipeline
Here's a hard-earned lesson: a data pipeline you can't trust is worse than no pipeline at all. Once your connector is up and running, it's time for the most important part: rigorous testing. This isn't just about spotting errors. It's about building complete confidence that your change data capture postgres setup is doing precisely what you think it is.
Never, ever assume things are working just because the connector dashboard shows a green "RUNNING" status. You have to actively validate the entire flow, from the database write-ahead log to the final destination. The best approach is to run a series of targeted, observable database operations—think of it as a controlled experiment where you know the input and can meticulously check the output.
Simulating Real-World Changes
Your validation process needs to mirror the kind of DML (Data Manipulation Language) activity your database sees every day. Forget about random test data. Instead, perform specific, atomic operations on a test table and trace each one from start to finish.
I always start with the trifecta of database operations. This simple, three-part test gives you a fantastic baseline.
- Execute an
INSERT: Add a brand-new record with unique values that are easy to spot. - Perform an
UPDATE: Now, change a specific field in that exact record you just created. - Run a
DELETE: Finally, remove that record from the table.
After each command, jump over to your downstream system. Whether you're sending data to a Kafka topic, a Snowflake table, or an S3 bucket, find the corresponding event. Scrutinize the payload. Did the INSERT event capture all the column values correctly? Did the UPDATE message show the "before" and "after" state of the row accurately? And did the DELETE event properly signal the removal, maybe with a tombstone record?
This isn't an optional step. It’s a non-negotiable check that confirms your publication is configured correctly and your connector is parsing the logical replication stream as you intended. If an event is missing, it almost always points back to a mistake in your publication setup or the table's REPLICA IDENTITY settings.
Failure and Recovery Testing
Okay, so standard operations work. That's only half the battle. A production-ready pipeline has to be resilient. You need to know what happens when things go wrong, so it’s time to simulate some failures and see how gracefully the system recovers.
A classic—and absolutely essential—test is to deliberately stop your CDC connector for a few minutes. While it's offline, go ahead and make several changes to your source tables. During this downtime, you can even query the pg_replication_slots view on your Postgres instance. You'll see the restart_lsn lag behind the current WAL position, which is the replication slot doing its job perfectly, holding onto those changes for you.
Now, restart the connector. You’re watching for three key things:
- No Data Loss: Every single change you made while the connector was down must appear in the destination, and in the correct order.
- Graceful Catch-Up: The lag on the replication slot should shrink rapidly and return to near-zero as the connector works through the backlog.
- Correct Ordering: The events have to be processed sequentially to ensure your downstream data maintains its integrity.
This one simple test proves that your replication slot is preventing data loss during an outage, a fundamental requirement for any serious change data capture postgres pipeline. For a deeper dive into the mechanics of CDC across different platforms, our guide on change data capture for SQL databases is a great resource.
Got Questions About Postgres CDC? We've Got Answers
Once you get past the initial setup of change data capture postgres, the real-world questions start to pop up. You start thinking about performance, what happens when things break, and how to keep it all running smoothly in production. It’s natural. Let's walk through some of the most common things that come up.
How Much Will This Slow Down My Database?
This is usually the first question on everyone's mind, and for good reason. Turning on logical replication by setting wal_level = logical does add a bit of overhead. PostgreSQL has to write more detailed information to its Write-Ahead Log (WAL), which means a slight bump in disk I/O.
But here’s the thing: for most modern systems, the impact is pretty negligible. More importantly, it's a far, far better alternative than the old-school, performance-killing method of using database triggers for CDC.
The real performance concern isn’t CPU; it’s disk space. If a replication slot isn't being read from, those WAL files will pile up. You absolutely must have solid monitoring on your pg_wal directory to keep your database disk from filling up and bringing everything to a screeching halt.
What About Schema Changes?
Ah, the classic ALTER TABLE problem. What happens when you need to add a new column to a table you’re tracking? This requires a coordinated dance, and how you do it depends a lot on your specific CDC tool.
Some tools are smart enough to handle certain DDL (Data Definition Language) changes on their own. However, for anything critical, I've found the safest, most reliable approach is often a manual one.
Here's a battle-tested sequence:
- Pause your consumer. Stop whatever application is processing the change events first.
- Make the database change. Run your
ALTER TABLEcommand directly on PostgreSQL. - Update the destination. If you're sending data to a data warehouse with a strict schema, you'll need to update its table definition to match.
- Restart the consumer. Turn your application back on to resume processing from where it left off.
Trust me on this: rehearse this entire process in a staging environment before you ever try it in production. It’s the only way to be sure you won’t lose data or break your pipeline.
What Happens if My Consumer Goes Down?
"So, my consumer application crashed. What now?" This is where the magic of replication slots really shines. The slot on your Postgres server will hold onto all the WAL files containing every single change that has happened since the consumer last connected.
It's an incredible safety net, guaranteeing zero data loss. But it comes with a serious catch. Those unread WAL files will accumulate on your database server's disk. If left unchecked, the disk will eventually fill up, and your entire database will crash.
This isn’t a theoretical risk; it’s a real-world scenario that can take down your production environment. You need aggressive monitoring and alerting on replication slot lag and disk usage to prevent it.
Ready to build a rock-solid, real-time Postgres CDC pipeline without all the operational headaches? Streamkap offers a fully managed solution that takes care of the tricky parts like logical replication, schema changes, and resilient data delivery. Start your free trial today.