Mastering Real Time Data Analytics
Unlock the power of real time data analytics. This guide covers key architectures, tools like Streamkap, and practical strategies for instant business insights.
Real-time data analytics is all about analyzing information the very moment it’s generated. This allows businesses to make smart decisions on the fly. A great way to think about it is your car's dashboard—it shows your speed and fuel level right now, not after you've already reached your destination. This is what real-time analytics does for a business: it turns a constant flow of raw data into immediate, actionable insights.
What Is Real-Time Data Analytics

Think about a retail website that instantly adjusts product recommendations the second you click on an item. Or a bank that spots and blocks a fraudulent transaction before the money is gone. This isn't a futuristic concept; it's real-time data analytics at work today. It completely closes the gap between when an event happens and when you can actually do something about it.
Unlike traditional methods that process data in batches—maybe once an hour or overnight—real-time analytics handles a continuous, unending stream of information. To make this happen, you need two things: high data velocity (the speed at which data arrives) and low-latency processing (the speed at which you can analyze it). These two elements are the engine behind instant insights. Getting a handle on what is real-time data is the first step to making your business more agile and responsive.
The hunger for this kind of immediacy is pushing the market forward at an incredible pace. The real-time analytics market is expanding by about 22.63% each year. There are now over 2,500 companies and more than 81,000 professionals working in this space, which shows just how vital instant data has become for modern business.
Data Processing Speeds Compared
To really understand why real-time analytics is such a big deal, it helps to see how it stacks up against the old ways of doing things. The key difference is latency—the delay between when data is created and when it’s ready to be used. Each method has its place, but they serve very different business needs.
The following table breaks down the three main approaches to data processing, highlighting how speed impacts what you can achieve.
Processing TypeData LatencyBest ForReal-TimeMilliseconds to secondsFraud detection, live monitoring, instant personalization, dynamic pricing.Near-Real-TimeSeconds to minutesOperational dashboards, customer support analytics, short-term forecasting.Batch ProcessingHours to daysPayroll processing, monthly financial reporting, historical trend analysis.
Choosing the right speed really comes down to what you're trying to accomplish. Batch processing is still perfect for things like end-of-month financial reports where you need deep historical accuracy. But for anything where immediate action gives you an edge, real-time data analytics is non-negotiable. It's the difference between reacting to what already happened and actively shaping what happens next.
How Real Time Analytics Transforms Industries

The real power of real time data analytics isn’t some abstract concept; it’s what happens when businesses can finally react to events the moment they occur, not hours or days later. It’s the engine behind everything from stopping online fraud in its tracks to making sure your package arrives on time. The applications are as varied as they are game-changing.
Let’s think about a major e-commerce site during a flash sale. Thousands of transactions are flying through every second, and so is the risk of fraud. The old way of doing things involved spotting a stolen credit card long after the order was processed and the item was shipped—a painful and expensive lesson.
Real time analytics completely changes the game. It sifts through transaction data—purchase size, location, user history—in the blink of an eye. If a purchase looks fishy and matches known fraud patterns, the system can kill the transaction on the spot. This isn't just about saving money; it's about building a secure experience that customers trust.
Powering Split-Second Financial Decisions
Nowhere is the need for speed more obvious than in finance. For high-frequency trading (HFT) firms, a few microseconds can be the difference between a massive profit and a devastating loss.
These firms depend on real time data analytics to drink from a firehose of market data—stock prices, breaking news, economic reports. Algorithms instantly spot tiny windows of opportunity and execute trades based on sophisticated models, all faster than a human could even blink.
By processing data the moment it’s created, financial institutions can capitalize on fleeting market opportunities, manage risk with unparalleled precision, and provide customers with instant, secure transaction experiences.
It's no surprise the financial services industry is all-in on this. The market for real-time data integration was pegged at around USD 23.4 billion in 2023 and is projected to skyrocket to nearly USD 128.4 billion by 2030. Banks alone are sinking billions into these systems. You can dig deeper into the growth of real-time data integration on integrate.io.
Optimizing Logistics and Manufacturing
This technology is also reshaping the physical world. Picture a global logistics company juggling millions of daily deliveries. They're constantly battling traffic jams, bad weather, and vehicle breakdowns.
Real time analytics brings order to that chaos.
- Dynamic Rerouting: GPS data streams from every truck. If an accident snarls up a highway, the system automatically finds a faster route for any affected drivers, keeping deliveries on schedule.
- Predictive Maintenance: Sensors are always monitoring engine performance, tire pressure, and other critical stats. The system can flag a part that's about to fail, letting mechanics fix it before the truck breaks down on the road.
The same logic works wonders in manufacturing. Instead of waiting for a key machine to grind production to a halt, companies use sensor data to predict when it needs service. This predictive maintenance prevents costly shutdowns and keeps the entire operation running smoothly.
Advancing Patient Care in Healthcare
Healthcare is another area seeing a massive shift, thanks to real-time data. Wearable tech and hospital monitors now provide a constant stream of patient vitals like heart rate, oxygen saturation, and blood pressure.
If a patient's numbers suddenly dip into a danger zone, the system can instantly alert doctors and nurses. This allows for immediate intervention that can literally save lives. It's a move away from periodic check-ins toward a continuous, live view of patient health, which leads to better care and much better outcomes.
Understanding Real-Time Data Architectures
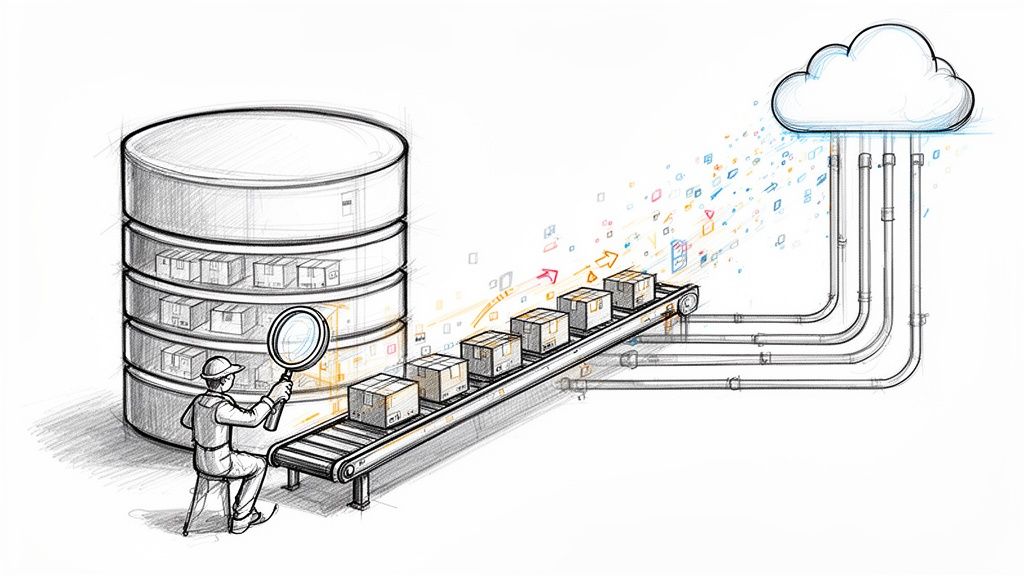
To really get what makes real-time data analytics tick, you have to look under the hood. The technology might seem complex, but the core ideas are actually pretty intuitive. I like to think of it as a high-tech factory assembly line: raw materials (your data) come in one end and are instantly turned into a finished product (valuable insights) at the other.
It all starts at the data source. Data is created everywhere, all the time. A customer clicking "add to cart," a sensor on a factory floor logging a temperature spike, a financial transaction clearing—these are all individual events. Each one is a tiny piece of a much bigger story waiting to be told.
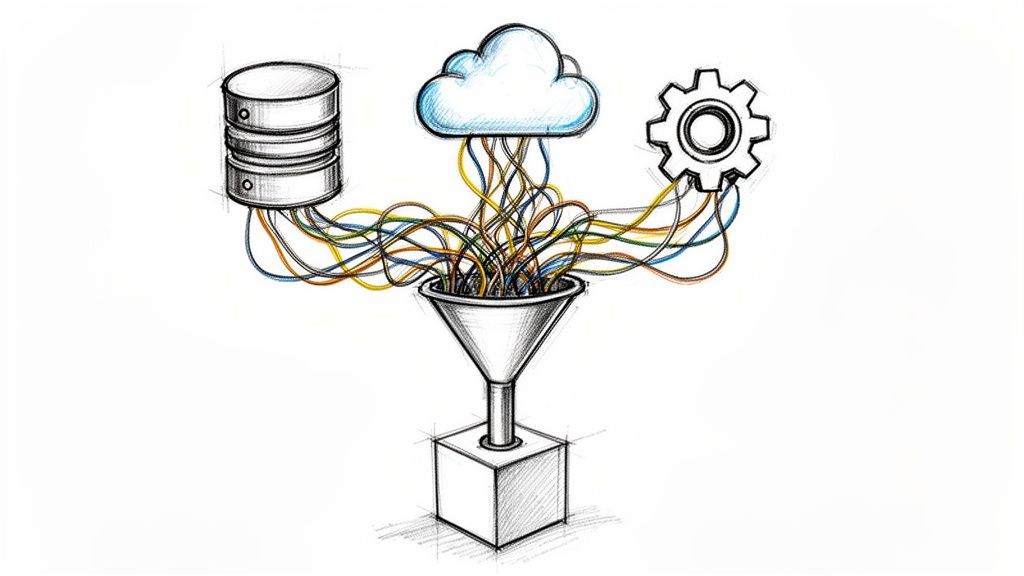
This image gives you a bird's-eye view of how all the pieces fit together.
As you can see, the architecture follows a clear path from ingestion to processing and finally to delivery. This creates a complete pipeline for turning raw data into immediate, actionable intelligence.
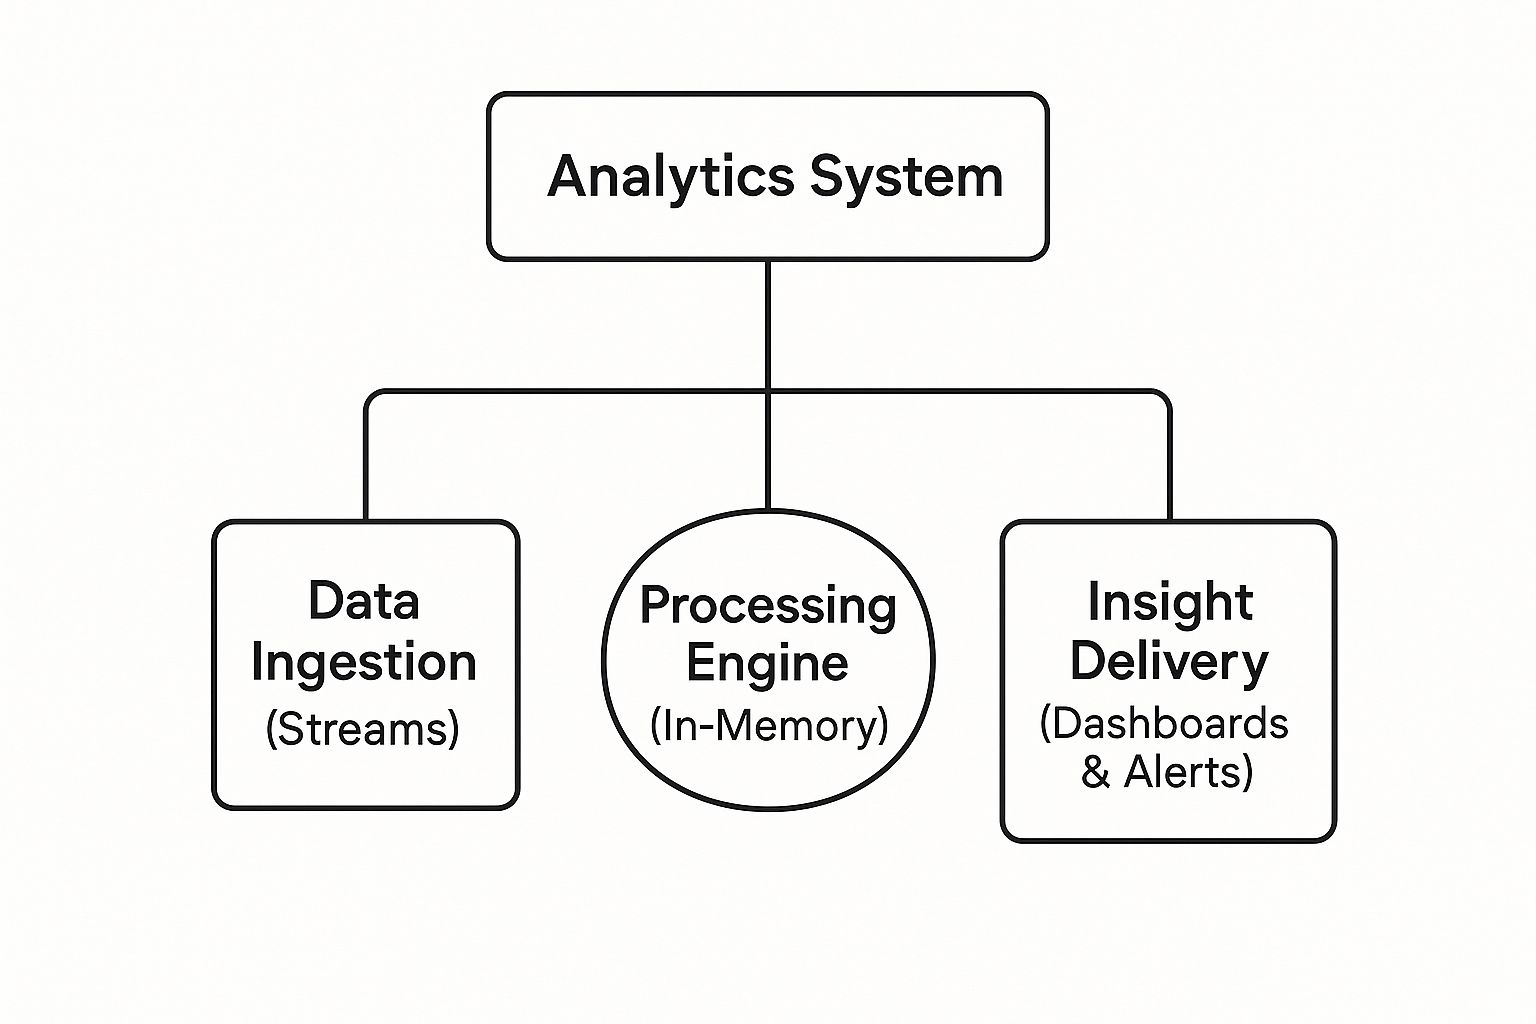
The Journey from Event to Insight
Once an event happens, that data has to be moved—fast. That's the job of data ingestion tools. Think of a high-speed conveyor belt that snatches up each piece of data the moment it's created. Technologies like Apache Kafka are brilliant at this; they act like a central nervous system, collecting endless streams of events from countless sources and funneling them toward the next stage.
Next up is the processing engine. This is where the real magic happens. Tools like Apache Flink or Spark Streaming work in-memory, which means they analyze the data while it’s still flying through the system, without ever stopping to write it to a disk. In just milliseconds, they can run calculations, spot patterns, or add more context to the data. This is the heart of real-time analytics, where raw events become meaningful signals.
Finally, the finished insights arrive at their destination: insight delivery. This could be anything from a live dashboard showing website traffic, an alert system flagging a potentially fraudulent transaction, or an automated system adjusting inventory levels on the fly. This is the end of our assembly line, where the value of real-time data becomes real.
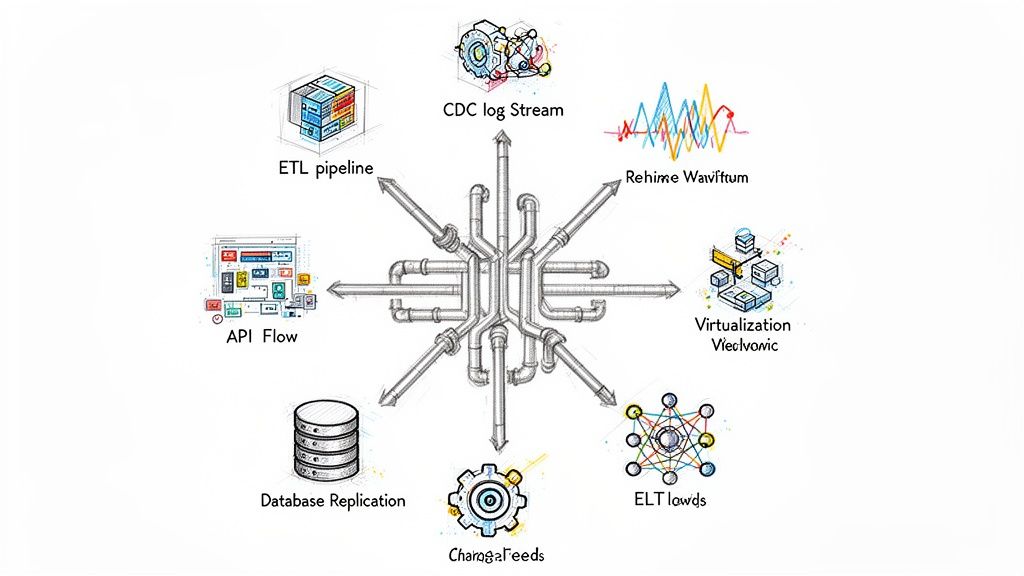
Two Dominant Architectural Patterns
While the components are generally the same, there are two main ways architects arrange them: the Lambda and Kappa architectures. You can think of them as two different blueprints for a city's highway system, each designed to manage data traffic in its own way.
- Lambda Architecture: This is the classic, more complex approach. It splits data into two separate paths: a "speed layer" for real-time analysis and a "batch layer" for deep, historical analysis. It's like having a high-speed express lane for immediate traffic alongside a wider, slower highway for heavy cargo. It’s powerful, but juggling two separate pipelines can be a headache.
- Kappa Architecture: This is the newer, more streamlined pattern. It uses a single, unified stream processing path for everything. All data, whether it’s happening now or happened last year, flows through the same system. This is more like having one incredibly efficient superhighway that handles every type of vehicle, which dramatically simplifies maintenance and reduces complexity.
The choice between Lambda and Kappa usually comes down to a trade-off between your specific needs and how much complexity you're willing to manage. That said, most modern systems are leaning heavily toward the Kappa architecture for its elegance and efficiency with pure streaming data.
Getting a handle on these foundational concepts is the first step toward building or using these powerful systems. If you want to dive deeper into how these components all connect, check out our guide on what is streaming architecture. It gives you a closer look at designing systems that deliver insights at the speed of business.
Building Your Data Pipeline with Streamkap
Knowing the theory behind real time data analytics is one thing, but actually building the infrastructure is a whole different ballgame. In the past, spinning up a real-time data pipeline was a massive undertaking. We're talking months of engineering work, wrestling with complicated open-source tools, and a ton of ongoing maintenance just to keep the lights on.
Thankfully, modern platforms like Streamkap have stepped in to close that gap.
Instead of getting bogged down in the nuts and bolts of Kafka, Flink, and custom code, a managed solution handles the grunt work for you. This frees up your team to focus on what really matters: finding valuable insights in the data, not just managing the plumbing. The core challenge has always been getting data from its source—be it a transactional database or a SaaS app—to your analytics platform without delays or data loss.
This is where a managed service really proves its worth. It takes care of the tricky mechanics of data integration, from connecting to all your different sources to making sure the data lands safely and correctly in its destination.

As you can see in the Streamkap interface above, what used to be a complex engineering project—connecting sources like databases and SaaS tools to destinations like Snowflake or BigQuery—is now as simple as a few clicks.
The Magic of Change Data Capture
One of the most effective techniques for real-time pipelines is Change Data Capture (CDC). Think of it like a quiet, efficient court reporter sitting inside your database. It doesn't constantly bug the database by asking, "Hey, what's new?"—a process called querying that can really slow things down. Instead, CDC just listens to the database's internal transaction log for updates.
Anytime a change happens—a new order comes in, a customer changes their address, inventory gets updated—CDC nabs that specific event right away. This approach gives you two huge wins:
- Minimal Impact: It doesn’t put any extra load on your production databases. Your applications keep humming along at full speed because the pipeline isn't hammering them with constant requests.
- True Real-Time Speed: It captures events the very millisecond they're official, ensuring the data flowing into your analytics platform is a perfect, up-to-the-moment mirror of what's happening in your business.
This efficiency is the secret sauce that makes low-latency analytics possible without killing the performance of your core operations.
A Conceptual Walkthrough of a Real-Time Pipeline
So, what does this look like in practice? Let's follow a single piece of data on its journey. Imagine a customer updates their shipping address in your e-commerce store's PostgreSQL database.
- Connect the Source: First, you connect your PostgreSQL database to Streamkap. This is a quick, one-time setup that creates a secure link to the database's transaction log.
- Capture the Change: The instant the customer saves their new address, CDC captures the event, noting the old value, the new value, and other key details.
- Transform the Stream: As this event zips through the pipeline, you can even apply transformations on the fly. Maybe you need to mask sensitive personal data or add extra information from another source. No problem.
- Load into the Destination: Finally, the transformed event lands in your cloud data warehouse, like Snowflake. This whole trip, from the customer’s click to the data being ready for analysis, takes just a few seconds.
Building a real-time pipeline from scratch means provisioning servers, managing clusters, writing complex code to handle parsing and errors, and hiring a dedicated team to maintain it. A managed platform automates 90% of that work, slashing both the cost and the time it takes to see any real value.
Managed Automation vs. DIY Complexity
The difference between building a pipeline yourself and using a managed service is night and day. The DIY path often results in brittle, high-maintenance systems that become a constant headache for your engineering team. If you're curious about the nitty-gritty, our guide on how to build data pipelines lays out all the steps involved.
On the other hand, a managed solution like Streamkap gives you an automated, resilient, and scalable foundation for all your real time data analytics projects. It hides all that low-level complexity, letting your team build powerful dashboards and applications that deliver immediate business value. It’s this shift from manual tinkering to automated synchronization that truly unlocks the power of instant data insights for any organization.
Overcoming Common Implementation Challenges
Switching to real-time data analytics is a game-changer, but let’s be honest—it’s not always a smooth ride. Like any major tech upgrade, it comes with its own unique set of headaches. Knowing what to expect is half the battle, and a little bit of planning can turn what look like huge roadblocks into manageable speed bumps.
Keeping Your Data Clean and Consistent
The first thing you’ll likely run into is the challenge of maintaining data quality and consistency. When you have thousands of events flying through your system every second, a tiny error can snowball into a massive problem downstream. Imagine a developer changes a field name in the source application without telling anyone—suddenly, your dashboards break and your analytical models start spitting out nonsense.
This is exactly why data contracts are so important. Think of a data contract as a formal handshake between the system producing the data (the source app) and the system consuming it (your analytics platform). It clearly defines the data's structure, format, and what it all means. It’s a safety net that keeps your data streams reliable, even as the applications around them change.
Scaling Without Spiraling Costs
Another big one is building a system that can handle huge amounts of data without your cloud bill going through the roof. The flow of real-time data can be wildly unpredictable. You might see massive spikes during a product launch or a holiday sale. If your system can't keep up, it will start dropping data or lag so badly that "real-time" becomes a joke.
The trick here is to lean on scalable, cloud-native tools. Modern data platforms like Snowflake or Databricks are built for this kind of elasticity. They can automatically ramp up processing power when you need it and scale it back down when things quiet down. This gives you two crucial advantages:
- Performance: Your system won't buckle under pressure during a traffic surge, so your insights are always on time.
- Cost-Effectiveness: You’re not paying for a ton of processing power to sit idle. You only pay for what you actually use.
Getting the cost part right is critical, especially since the investment in this space is exploding. The global data analytics market, once valued between $50 billion and $64.75 billion, is projected to hit nearly $658.64 billion by 2034. You can get the full rundown on these market trends from this forecast by Precedence Research.
Building a Culture That's Ready to Act
Maybe the biggest challenge of all has nothing to do with code or infrastructure. You can have the best real-time analytics setup in the world, but it’s worthless if no one in your organization is prepared to act on the information. If your teams are used to making decisions based on reports that come out once a week, they need to learn to operate at a much, much faster pace.
An instant insight is only valuable if it’s followed by an immediate, intelligent action. Without a culture that empowers teams to respond quickly, even the most advanced real-time dashboard is just a collection of interesting numbers.
Creating this kind of data-driven culture has to start from the top. It means training people to understand and trust live data, giving them the authority to make decisions on the spot, and celebrating the wins that come from being quick and responsive. When the technology and the culture finally click into place, that’s when real-time data stops being a tool and becomes a real competitive advantage.
What's Next for Real-Time Data Analytics?
The world of real-time data analytics isn't just evolving; it's getting faster and smarter. We're moving past simply knowing what's happening right now. The real goal is shifting to a much more powerful question: "What's going to happen next, and what should we do about it?"
This leap forward is happening thanks to the powerful combination of live data streams and artificial intelligence. When you feed real-time data directly into machine learning models, you unlock the ability to make incredibly accurate predictions. Think about an e-commerce site that doesn't just see a traffic spike—it anticipates a stockout on a popular product hours ahead of time and automatically triggers a new order. That's the future we're building.
Key Technologies Driving the Shift
A few key technologies are making this predictive future possible. They're simplifying the complex infrastructure behind real-time data and pushing the processing power closer to where the data is actually created.
- AI and Machine Learning: This is the biggest game-changer. Instead of reacting to events after they occur, systems will start to anticipate them. This means predictive maintenance for factory equipment, stopping fraud before a transaction completes, and creating hyper-personalized customer experiences that adapt in the moment.
- Serverless Streaming Platforms: The days of wrestling with complex clusters for tools like Kafka or Flink are numbered. Serverless platforms take care of all the scaling, maintenance, and fault tolerance for you. This lets teams focus on building great real-time apps, not on becoming infrastructure gurus, which massively lowers the barrier to getting started.
- Edge Computing: It doesn't always make sense to send every piece of data to a central cloud for processing. Edge computing analyzes data directly on or near the device it comes from—an IoT sensor, a retail point-of-sale system, you name it. This slashes latency for applications where every millisecond counts, like in autonomous vehicles or smart factory robotics.
The bottom line is that these technologies are transforming real-time data analytics from a highly specialized, resource-intensive discipline into a fundamental capability for any business. It's no longer a luxury for tech giants but a core part of staying competitive.
Ultimately, diving into real-time analytics is an investment in becoming a more agile, intelligent, and resilient organization. The question for businesses isn't if they should adopt real-time data, but how fast they can get started. By embracing these trends, you can uncover new opportunities, innovate more quickly, and build a smarter, more responsive company. The time to begin your real-time journey with a platform like Streamkap is now.
Frequently Asked Questions
Even after getting the basics down, you might still have a few questions about how real-time data analytics works in practice. Let's tackle some of the most common ones we hear from people just starting out.
Real-Time Analytics vs. Business Intelligence
This is a big one. What’s the actual difference between real-time analytics and traditional business intelligence (BI)?
Think of it like this: real-time analytics is your car's live dashboard, while BI is the detailed service history report you get from the mechanic.
- Real-time analytics is all about what’s happening right now. It's that live dashboard, processing data in milliseconds to help you make immediate decisions. This is crucial for things like spotting fraud as it happens or adjusting prices on the fly. Its goal is purely operational—to act in the moment.
- Business intelligence is the service history. It looks back at historical data over days, weeks, or even months to find patterns and shape long-term strategy. BI is all about learning from the past to plan for a better future.
So, while BI answers, "What happened last quarter?", real-time analytics answers, "What's happening this very second?"
Do I Need Big Data for Real-Time Analytics?
How much data do you really need to get any value from real-time analytics?
It's a common myth that you need massive, petabyte-scale data to get started. The truth is, the key factor isn't the volume of your data; it's the velocity and its time-sensitivity.
Even a modest stream of data can be incredibly powerful if acting on it instantly gives you an edge. An e-commerce site with just a few thousand transactions a day, for example, can still slash fraud by analyzing each payment the moment it occurs.
The real question isn't "Do I have enough data?" It's "Is there value in acting on my data the instant it's created?" If the answer is yes, then real-time analytics is for you, no matter the scale.
First Steps for Implementation
Okay, I'm sold. But where do I even begin with building a real-time data pipeline?
It can feel like a huge undertaking, but you can make it manageable by breaking it down. Here's a simple roadmap to get you started:
- Identify a High-Impact Use Case: Don't try to do everything at once. Start small and pick one specific business problem where speed is everything. This could be anything from monitoring website performance to tracking critical inventory levels.
- Pinpoint Your Data Sources: Figure out exactly where the data you need lives. Is it sitting in a production database like PostgreSQL? Is it generated by a SaaS tool or an IoT device?
- Choose Your Tools: Look into modern data pipeline platforms. A managed service that handles the tricky parts, like Change Data Capture (CDC) and stream processing, can dramatically cut down your initial engineering workload and cost.
- Build a Proof of Concept (POC): Set up a basic pipeline connecting your source to a destination like Snowflake or BigQuery. This small-scale project will help you prove the value and learn the ropes before you think about scaling up.
Focusing on a single, clear goal makes that first implementation far less intimidating and helps you build the momentum you'll need for wider adoption.
Ready to build your first real-time pipeline without the usual headaches? Streamkap offers a fully managed, automated platform that lets you connect sources and start streaming data in minutes, not months. Start your free trial today.