operational reporting vs analytical reporting: A Practical Guide
Discover the key differences between operational reporting vs analytical reporting and when to use each to drive better decisions.
The real difference between operational and analytical reporting boils down to two things: purpose and time. Operational reporting is all about the now. It uses live, real-time data to help people manage day-to-day business activities. In contrast, analytical reporting looks at the past and future, digging through historical data to spot trends and shape long-term strategy.
Defining the Core Differences
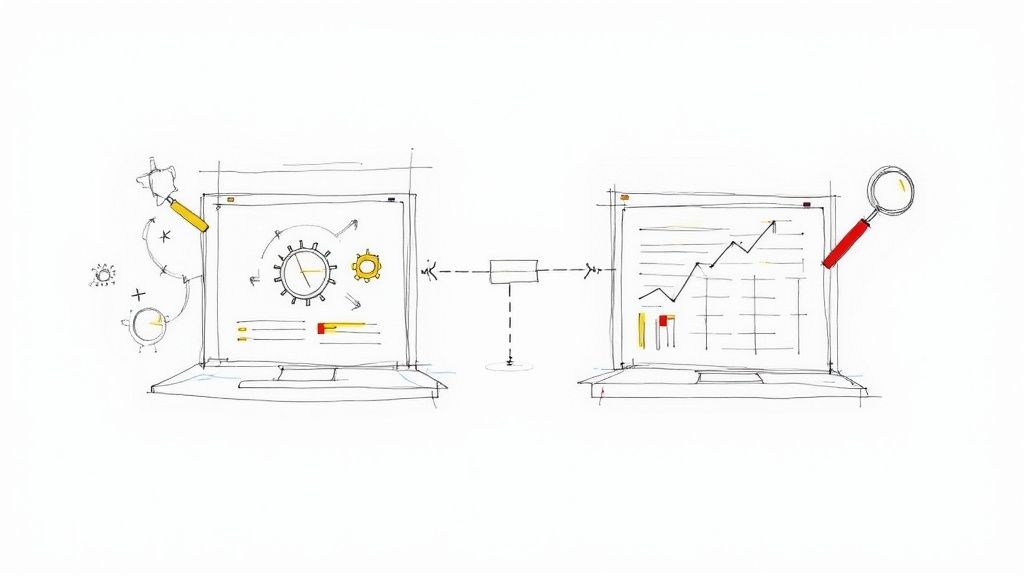
At its core, operational reporting answers one simple question: “What is happening right now?” It’s the live heartbeat of the business, giving frontline teams and managers the instant feedback they need to keep things running. Picture a live inventory dashboard in a warehouse or a customer support queue showing current wait times. These reports are transactional, granular, and built for immediate action.
Analytical reporting, on the other hand, asks, “Why did this happen, and what’s likely to happen next?” It’s the strategic, 30,000-foot view that comes from sifting through massive amounts of historical data. Executives and analysts rely on these insights to find patterns, forecast what’s coming, and make smarter strategic bets. A great example is a quarterly sales trend analysis or a report on customer lifetime value. The goal here isn’t immediate action but discovery and long-term planning.
This image does a great job of showing their distinct roles at a glance.
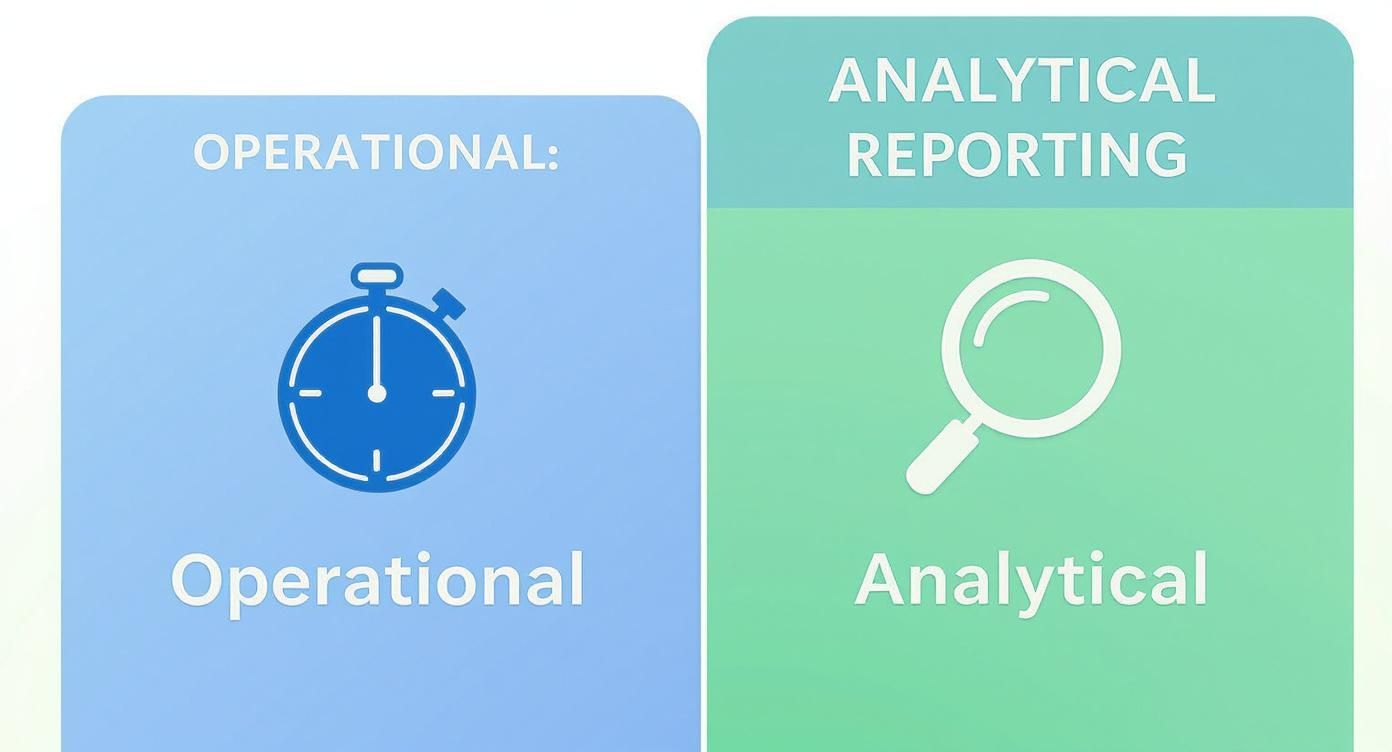
You can see how the stopwatch for operational reporting emphasizes speed and current status, while the magnifying glass for analytical reporting is all about deep investigation and historical context.
A Side-by-Side Comparison
To really get a feel for how they function in the wild, it helps to put them head-to-head on a few key attributes. Think of operational reporting as the system that needs real-time or near-real-time data to give immediate feedback on business processes, allowing teams to react quickly. Meanwhile, analytical reporting is perfectly happy with historical data that spans months or years, because its job is to uncover the trends and patterns that guide major business decisions. For a deeper dive into how their data sources and applications differ, you can find more information from the team at Orbit Analytics.
To make it even clearer, here’s a table that breaks down the crucial differences.
Core Distinctions: Operational vs. Analytical Reporting
This summary table highlights the core distinctions between operational and analytical reporting across several key dimensions.
AttributeOperational ReportingAnalytical ReportingPrimary GoalMonitor and manage daily operations.Identify trends and support strategic planning.Data FreshnessReal-time or near-real-time.Historical (days, months, years).Key UsersFrontline staff, operational managers.Business analysts, executives, strategists.Query ComplexitySimple, repetitive, pre-defined queries.Complex, ad-hoc, exploratory queries.Data ScopeHighly detailed, granular, transactional.Aggregated, summarized, multi-dimensional.FocusTactical decisions (“What’s happening now?”).Strategic insights (“Why did it happen?”).
Ultimately, both are vital, but they serve completely different masters and solve different problems. Understanding which one you need—or when you need both—is fundamental to building a data-driven organization.
Understanding the Data Architecture Divide
The core differences between operational and analytical reporting aren’t just about the questions they answer; they run deep into the technical foundations. These two functions operate on entirely different architectural engines, a deliberate separation that’s absolutely critical for performance. Trying to force both types of reporting out of a single system is like asking a Formula 1 car to tow a freight trailer—it’s just not built for that job.
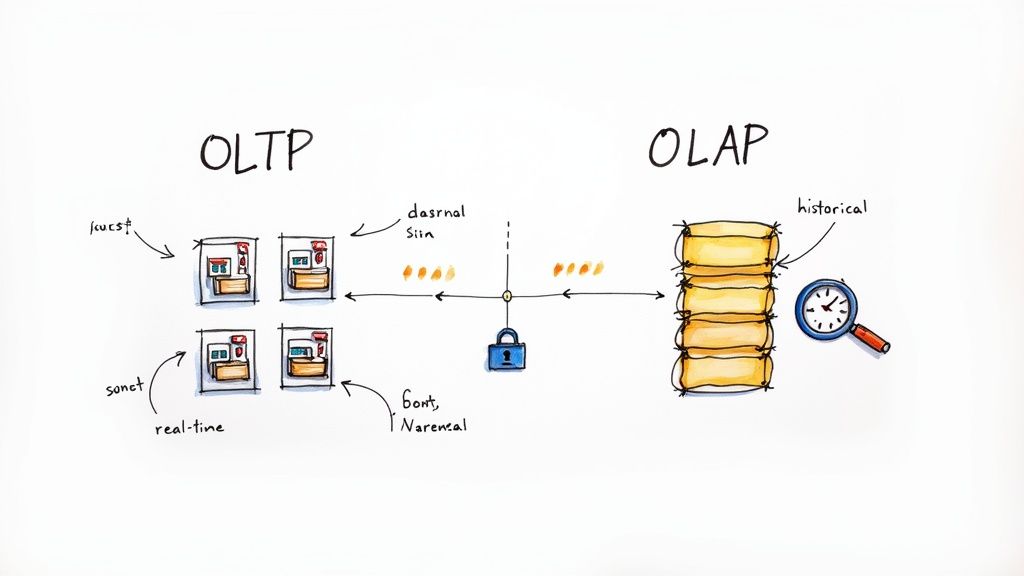
The best way to grasp this split is by looking at Online Transaction Processing (OLTP) versus Online Analytical Processing (OLAP) systems. Each one is purpose-built for its corresponding reporting style.
OLTP: The Engine of Daily Operations
Operational reporting gets its power from OLTP databases. Think of these as the workhorses of the business, designed to handle a massive volume of short, fast transactions. Every time a customer places an order, an agent updates a support ticket, or a payment is processed, an OLTP system is at work. Its main job is ensuring speed and data integrity for what’s happening right now.
To do this, OLTP systems use a normalized data structure. Data is broken down into many small, specific tables to avoid redundancy. For instance, a customer’s address is stored just once, not repeated with every single order they make. This setup is brilliant for quick writes and updates but makes pulling together complex reports across many tables painfully slow.
Key Takeaway: An OLTP system is optimized for capturing live business events with speed and accuracy. Firing off a massive analytical query against it can lock up critical tables and bring daily operations to a grinding halt.
OLAP: The Foundation for Strategic Insight
On the other side of the fence, analytical reporting runs on OLAP systems. These are your data warehouses and data lakehouses, engineered specifically to analyze huge volumes of historical data, not process live transactions. Their purpose is to enable complex, multi-dimensional queries that reveal trends and patterns over long periods.
To support this kind of deep-dive analysis, OLAP systems use a denormalized schema, like a star or snowflake schema. Data is intentionally duplicated and consolidated into fewer, much wider tables. This structure makes it incredibly efficient to aggregate data across different dimensions—like total sales by region over the last five years—without wrestling with complicated joins. For a closer look at these large-scale systems, see our guide comparing the data lakehouse vs the data warehouse.
This separation is also clear in their data processing needs. Operational systems manage high volumes of real-time transactions that are vital for day-to-day business. Analytical reporting, however, uses OLAP systems built to handle enormous volumes of aggregated, historical data, all optimized for complex querying.
Why This Separation Is Non-Negotiable
This architectural divide between OLTP and OLAP isn’t just a best practice; it’s a necessity driven by raw performance. You simply can’t mix these workloads without something breaking.
Here’s a quick breakdown of why they have to stay in their own lanes:
- Workload Conflict: OLTP systems are masters of many small
INSERT,UPDATE, andDELETEoperations. OLAP systems, however, are built for a few huge, read-heavySELECTqueries that might scan millions or billions of rows. These two workloads are fundamentally at odds. - Performance Impact: A single complex analytical query hitting an OLTP database can hog CPU and memory, slowing down or even crashing the very system your business depends on to make money.
- Data Structure: The highly normalized structure of an OLTP database is awful for analysis. Conversely, the denormalized structure of an OLAP system is completely inefficient for handling rapid, single-row transactional updates.
In the end, keeping these systems separate ensures your real-time operations stay fast and reliable, while your analysts have the freedom to explore historical data without any risk of disrupting the business.
Comparing Real-World Business Scenarios
Technical definitions and architectural diagrams are great, but the real test is seeing how these concepts play out in the real world. Let’s move beyond theory and look at how operational reporting and analytical reporting actually empower people to make critical decisions on the ground.

By exploring a few industry examples, you’ll get a gut-level feel for how each reporting style drives completely different outcomes.
Scenario 1: Retail Operations
Picture this: it’s the peak of the holiday shopping rush. A retail store manager is in the thick of it, trying to keep the sales floor from descending into chaos. They need data, and they need it now.
Operational Reporting in Action:
The manager is constantly checking a real-time dashboard on a tablet. This is a perfect example of operational reporting, feeding them live metrics that demand immediate action:
- Current Inventory Levels: Is that hot-ticket item about to sell out?
- Point-of-Sale (POS) Transactions: Which checkout lines are getting slammed?
- Staffing Levels: Are there enough people on the floor to handle the customer wave?
The moment the dashboard shows a popular sneaker is down to its last five pairs, the manager can dispatch someone to the stockroom to restock the shelf. This is a tactical, in-the-moment decision, powered entirely by live data.
Analytical Reporting’s Role:
Now, let’s jump forward a few weeks. A regional director for that same retail chain is planning for next year’s holiday season. They aren’t worried about one store’s sneaker inventory on a specific Saturday; they need to see the bigger picture.
They turn to an analytical report that pulls together historical data from all stores over the last three years. This report helps them answer strategic questions like:
- Which products consistently sold out first across the entire region?
- How did last year’s promotional campaigns actually affect foot traffic?
- What are the long-term sales trends we can use to forecast staffing needs for next year?
This analysis informs multi-million dollar decisions about purchasing, marketing budgets, and hiring. It’s a world away from the store manager’s immediate, operational focus.
Scenario 2: Logistics and Supply Chain
In the logistics game, timing is everything. A single delay can trigger a domino effect of problems, which makes the contrast between operational and analytical reporting crystal clear.
Operational Reporting in Action:
A logistics coordinator at a shipping hub is watching a live map of their entire truck fleet. Their operational report is a GPS-powered dashboard showing:
- Real-time Truck Locations: Where is every single vehicle right now?
- Delivery Status Updates: Which packages have been successfully dropped off?
- Live Traffic Alerts: Are there accidents or snarls on planned routes?
Suddenly, an alert flags a major highway shutdown. The coordinator instantly sees which trucks are about to hit the gridlock. Using this report, they can reroute drivers in real-time, avoiding the delay and making sure packages still arrive on schedule.
Key Insight: Operational reporting empowers frontline employees to react to the unexpected in an instant. Its value is measured in minutes and hours, directly impacting customer satisfaction and keeping things running smoothly.
Analytical Reporting’s Role:
Meanwhile, the company’s Director of Supply Chain is focused on optimizing the entire delivery network for the next fiscal year. Their analytical reports don’t show individual truck locations. Instead, they reveal broad, strategic patterns from years of accumulated data.
These reports help answer the big questions:
- Which delivery routes are consistently our most and least profitable?
- What is the average fuel consumption and maintenance cost for each vehicle type in our fleet?
- How do seasonal demand spikes affect delivery times across different regions?
The director uses these insights to redesign delivery networks, negotiate better fuel contracts, and decide what kinds of vehicles to invest in next. This is high-level strategic planning, not real-time crisis management. These kinds of deep dives are excellent examples of how to apply data, and you can explore more in our guide to real-time analytics use cases.
Scenario 3: Software as a Service (SaaS)
For a SaaS company, user engagement and customer health are the lifeblood of the business. Both types of reporting are essential for managing and growing the user base.
Operational Reporting in Action:
A customer support manager is responsible for a team fielding user inquiries. Their operational dashboard gives them an up-to-the-minute pulse on the support queue, showing:
- Current Ticket Volume: How many new requests are flooding in?
- Average Response Time: How fast are we getting back to our users?
- Agent Status: Who is actively on a call, and who is available?
If the average response time suddenly spikes, the manager can immediately reassign agents or escalate critical issues to stop customer frustration in its tracks.
Analytical Reporting’s Role:
In another part of the company, a product manager is planning the next major feature release. They are immersed in analytical reports that crunch user behavior data gathered over the last 18 months. Their analysis is looking for patterns:
- Feature Adoption Rates: Which features are our users loving, and which are they ignoring?
- User Cohort Analysis: Do users who sign up in January behave differently from those who join in June?
- Churn Indicators: What sequence of actions often happens right before a customer cancels their subscription?
These insights are the foundation of the product roadmap. They help the team decide whether to build something new, improve an existing feature, or kill a tool that nobody uses. The goal here isn’t managing today’s support tickets—it’s strategically improving the product for the long haul.
How to Choose the Right Reporting Strategy
Deciding between operational and analytical reporting isn’t an either/or dilemma. It’s a strategic choice that hinges entirely on the business problem you’re trying to solve. To make the right call, you have to move beyond generic definitions and ask the right questions about the situation at hand. The answers will point you to the right data, tools, and architecture.
At the heart of it, this decision really comes down to three key questions. If you can answer these honestly for any new reporting request, you’ll almost always land on the correct approach.
Who Needs the Information?
First and foremost, ask yourself: who is this for? The end user’s role within the company is probably the single biggest clue as to which type of reporting they need.
- Frontline Staff and Operational Managers: Think about a warehouse manager, a call center lead, or a retail supervisor. These folks need to make immediate, tactical decisions. They rely on operational reporting to see what’s happening right now and manage their teams minute-by-minute. Their focus is narrow, specific, and all about taking action.
- Executives, Analysts, and Strategists: This group has a different mission. They’re focused on long-term planning, spotting trends, and setting the company’s direction. They need analytical reporting to zoom out, understand historical performance, and model future possibilities. Their questions are broad and often exploratory.
What Is the Decision Timeframe?
Next, think about the urgency of the decision the report will support. How fast does someone need to act on this information?
This question gets straight to the point of data freshness. If a decision has to be made in seconds or minutes—like rerouting a delivery truck to avoid a sudden traffic jam—you are squarely in the world of operational reporting. It demands real-time data, period.
But if the decision plays out over weeks, months, or even years—like setting the next annual budget or deciding to enter a new market—then you’re looking at analytical reporting. In this case, historical accuracy and having a complete dataset are far more valuable than what happened two seconds ago.
Key Takeaway: The speed of the decision dictates the required freshness of the data. Immediate actions demand operational reports fueled by live data streams, while long-term strategies are built on analytical reports that use historical datasets.
How Granular Must the Data Be?
Finally, consider the necessary level of detail, or granularity. How deep into the weeds do you need to go to make a smart decision? This will shape the scope and structure of the data you work with.
Operational reporting lives and breathes on high-resolution, granular data. A customer support agent needs the specific details of a single customer’s ticket, not the average ticket resolution time for the whole quarter. The data is transactional, focused on one event at a time.
On the other hand, analytical reporting almost always works with aggregated and summarized data. An executive looking at sales performance doesn’t want to see every single transaction. They need to see total sales by region, product category, and time period to spot the patterns that matter. The focus is on the trends, not the individual data points.
Organizations that get this balance right see real results. By 2023, Gartner found that companies with integrated operational and analytical data strategies saw up to a 30% improvement in decision-making speed and a 25% reduction in operational waste. You can discover more insights on reporting strategies from Visier.com. It’s a powerful reminder of what happens when you use the right tool for the job.
Ultimately, the difference between operational reporting vs analytical reporting is all about matching the data’s purpose to the user’s need. By thinking through the user, the timeframe, and the data granularity, you can build a reporting strategy that puts the right insights in front of the right people, right when they need them.
Bridging the Gap With Modern Data Streaming
The old way of thinking forced a tough choice between operational and analytical reporting. You could have real-time data for day-to-day tasks or deep strategic insights from historical data, but never both at once. That trade-off, born from the necessary separation of OLTP and OLAP systems, is quickly becoming a thing of the past thanks to modern data streaming.
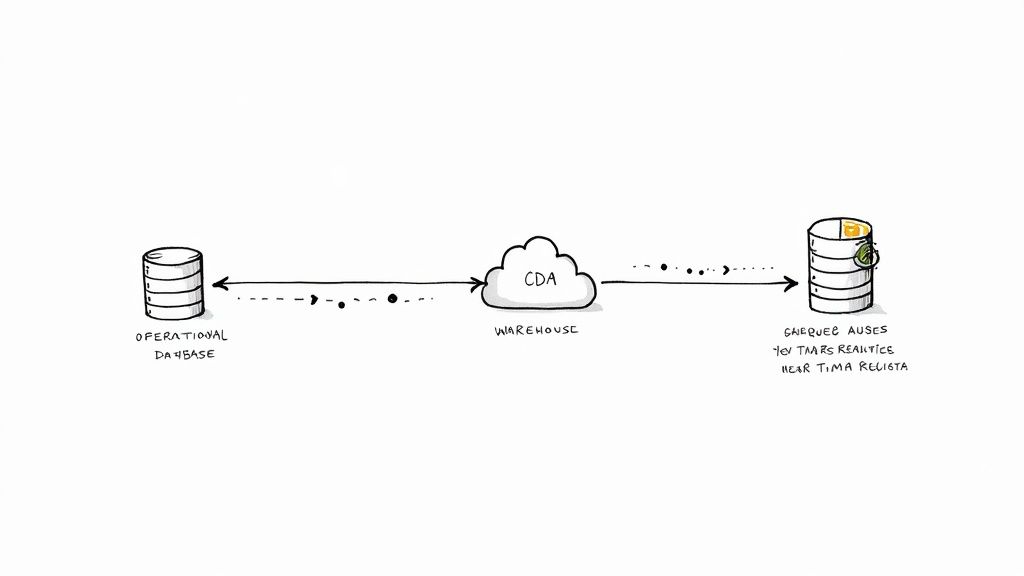
The new approach doesn’t try to force these two very different workloads together. Instead, it builds a high-speed, low-impact bridge between them. This allows a constant flow of data from operational databases into analytical warehouses in near real-time, all made possible by technologies like Change Data Capture (CDC).
The Power of Change Data Capture
Change Data Capture (CDC) is the real engine behind this modern architecture. Forget running heavy, performance-killing queries on your live production database. CDC takes a much smarter approach by reading the database’s internal transaction log—the detailed record of every INSERT, UPDATE, and DELETE command.
By tapping directly into this log, CDC captures every single data change the moment it happens, without adding any extra load to the source system. This is a critical point. It means you can stream a continuous feed of changes from a busy PostgreSQL or MySQL database without slowing down the applications your customers are using.
This effectively turns your static, siloed operational data into a dynamic, live stream of events that can be sent anywhere.
Key Insight: CDC is the key to safely unlocking real-time data from operational systems. It offers a non-intrusive way to access every granular change, turning your transactional database into a live data source for analytics with zero performance penalty.
This fundamental shift in how we move data is a game-changer for any business that can’t afford to wait for nightly batch jobs anymore. The difference between batch processing and a streaming approach is profound. For a deeper dive into how these methods compare, check out our guide on batch vs stream processing.
Creating the Real-Time Analytical Environment
Once CDC has captured the change events, a streaming platform takes over. Think of this platform as the super-fast transport layer, moving that data from the source database to an analytical powerhouse like Snowflake, Google BigQuery, or Databricks with incredibly low latency.
This continuous flow essentially mirrors the operational state in your analytical environment, keeping it just seconds behind the source of truth, not hours or days.
This architecture gives rise to a powerful new capability: “operational analytics.” It’s a hybrid model that applies sophisticated analytical techniques to incredibly fresh, near-real-time data. This lets businesses analyze what’s happening right now, not just what happened last week.
Real-World Impact of a Streaming Architecture
The benefits of this unified strategy are concrete and felt across the entire organization. It finally closes the gap in the operational reporting vs analytical reporting debate by fostering a more fluid and responsive data ecosystem.
Just look at what a streaming architecture makes possible:
- Dynamic Pricing: An e-commerce platform can analyze live clickstream data and purchases to adjust prices on the fly, reacting instantly to competitor moves or surges in demand.
- Fraud Detection: A financial services company can stream transaction data into an analytics model to spot and block fraud within milliseconds, instead of discovering the damage hours later.
- Supply Chain Optimization: A logistics firm can monitor real-time inventory and shipping data to proactively identify bottlenecks and reroute shipments before a delay ever happens.
In every one of these cases, the ability to analyze up-to-the-second operational data provides a massive competitive edge. It empowers teams to make smarter tactical decisions that are also informed by a wider analytical context. This modern data stack doesn’t just improve existing reporting; it unlocks entirely new ways of running a business. By bridging the operational and analytical worlds, data streaming helps build a smarter, more agile enterprise.
Frequently Asked Questions
After digging into the architectures and real-world examples, you probably have a few practical questions. The line between operational and analytical reporting can seem crystal clear on paper but often gets fuzzy in practice, especially with all the modern data tools out there. Let’s tackle the most common questions head-on to help you build your data strategy with confidence.
Can I Use the Same Tool for Both Reporting Types?
Technically, yes, but you’d be walking into a performance minefield without a very careful plan. Modern business intelligence (BI) tools like Tableau or Power BI are flexible enough to connect to both an operational database (like PostgreSQL) and a data warehouse (like Snowflake). The problem is, they’re built for completely different jobs.
Trying to run heavy, exploratory queries from a BI tool directly on your live operational database is a recipe for disaster. Those queries hog resources and can grind the very applications your business depends on to a halt. The reverse is also a problem; a tool designed for quick, simple lookups will likely buckle under the weight of a multi-terabyte data warehouse.
A hybrid strategy is almost always the smarter way to go:
- For Operational Reports: Stick to lightweight, often embedded dashboards built right into your operational apps. They’re designed for simple, pre-defined queries that fetch specific data points with minimal delay.
- For Analytical Reports: Always, always point these to a dedicated analytical platform like a data warehouse or data lakehouse. This insulates your production systems from performance hits and gives analysts the freedom to explore data without constraints.
The real magic happens when you bridge these two worlds with a real-time data pipeline. By streaming changes from your operational source to your analytical warehouse, you can use a single BI tool to get both historical context and near real-time operational views, all without crippling either system.
What Is Operational Analytics and How Does It Fit In?
Operational analytics is the next step in the evolution—a hybrid that completely blurs the old lines between operational and analytical work. It’s not just about seeing what’s happening now (operational) or analyzing what happened last year (analytical). Instead, it’s about embedding analytical insights directly into day-to-day business processes to drive immediate action.
Think of it as making your operations smarter on the fly.
The Key Distinction: Operational reporting shows you what is happening. Operational analytics tells you what to do about it right now, powered by data models.
A classic example is an e-commerce site:
- Operational Reporting: A dashboard shows that 5,000 users are currently active.
- Operational Analytics: As a shopper clicks around, a machine learning model analyzes their real-time behavior, compares it to historical buying patterns, and instantly generates personalized product recommendations.
This kind of immediate, intelligent action is only possible with a modern data stack. It demands a constant stream of fresh data flowing from operational systems into analytical models, which then feed insights right back into the application—all in a matter of milliseconds.
How Do I Evolve From Operational to Analytical Reporting?
Making the jump from basic operational dashboards to a full-fledged analytical capability is a common milestone for any growing business. It’s how you shift from being reactive to proactive. The journey usually follows a few key stages.
- Define Your Strategic Questions: Start with what you can’t answer today. What long-term trends, hidden customer behaviors, or operational blind spots are holding you back?
- Establish a Central Data Hub: You need a proper home for your historical and analytical data. This is typically a cloud data warehouse like Snowflake, BigQuery, or Databricks, which are built for this kind of large-scale work.
- Implement a Data Integration Pipeline: Next, you have to get your data from your operational systems into this new hub. Old-school batch ETL is an option, but modern approaches using Change Data Capture (CDC) are vastly superior. They stream data changes in near real-time without putting a heavy load on your source databases.
- Start Small, Deliver Value: Don’t try to boil the ocean. Pick one or two high-impact analytical dashboards that directly answer the strategic questions you identified earlier. A quick win builds momentum and gets people excited.
- Foster a Data-Informed Culture: Finally, you need to train your teams to actually use these new insights. The goal is to help them enrich their daily operational views with a deeper, more strategic understanding of the business.
What Are the Biggest Challenges of Separate Systems?
Keeping operational and analytical systems separate is essential for performance, but it creates its own set of headaches. For years, these have been major pain points for data teams.
The three main challenges are:
- Data Latency: This is the big one. When data only moves in batches—say, once every 24 hours—your analytical system is perpetually out of sync with reality. This “data lag” means your biggest strategic decisions are based on old news, a huge risk in any fast-moving market.
- Architectural Complexity: Juggling two completely different infrastructures (OLTP and OLAP) is complicated and expensive. It demands different skill sets, separate maintenance windows, and fragile data pipelines to shuffle data between them. This complexity often leads to brittle systems and data consistency nightmares.
- Cost and Resource Drain: Running duplicate infrastructure, paying for different software licenses, and hiring specialized engineers for each environment really adds up. The complex ETL/ELT jobs required to bridge these silos are notorious for being a huge engineering drag and a common point of failure.
This is exactly where modern streaming technologies come in. By creating a simplified, real-time bridge, they attack these problems at the source. This approach slashes latency, simplifies the overall architecture, and ultimately lowers the total cost of ownership by creating a more cohesive and efficient flow of data.
Unlock the full potential of your data by eliminating the gap between your operational and analytical systems. Streamkap provides a fully managed, real-time data streaming platform powered by Change Data Capture (CDC) that effortlessly syncs your operational databases with your analytical warehouse. Start building faster, smarter data pipelines today. https://streamkap.com
Related resources
10 Powerful Real Time Analytics Use Cases for 2025
Explore 10 powerful real time analytics use cases revolutionizing industries. See practical examples, tech stacks, and how to implement them today.