Silent CDC Failures and Timeout Detection: Building Durable Alerting
Streamkap Team
June 3, 2026
TL;DR
• Track WAL slot lag and consumer group lag, not just connector state: latency creep costs more than hard crashes • Durable log-position recovery avoids re-snapshots when a connector restarts, but only if the replication slot survives • Route alerts by severity so your team gets actionable notifications across Slack, Datadog, and PagerDuty
A bulk load runs on a source database at 2 AM. The CDC connector falls behind, times out on a subset of tables, and recovers, logging the timeout as a warning. By morning, every dashboard shows green. Throughput looks normal. At 3 PM, the data team files a ticket: the previous day’s order-update report is wrong. About 40,000 UPDATE events never made it to the warehouse.
No alert fired. The logs recorded the timeout. Nobody saw it.
That’s the failure mode CDC observability needs to solve for. Not the hard crash (which most teams already handle), but the partial failure that logs diligently, recovers silently, and leaves a gap in downstream data that surfaces hours later in a broken report.
The Silent Failure Problem: Why Logs Aren’t Enough
Hard failures are easy to catch. The connector stops, an error surfaces, on-call responds. The remediation path is clear: identify the failure point, restart the connector, replay from the stored log position.
Silent failures work differently. Replication lag accumulates slowly during a bulk load: 30 milliseconds at a time, then 300, then 3,000. A schema change on the source causes deserialization errors that route events to the dead-letter queue rather than the destination. A network hiccup between the connector and the message broker causes backpressure that builds over hours before any threshold is crossed. Each state produces log output, sometimes quite a lot of it, but that output blends into the noise of normal operation.
The paradox of comprehensive logging: when everything is recorded, nothing stands out. Triage becomes a search problem rather than a signal problem. By the time a failure is confirmed, it’s often 6 to 8 hours old.
Recovery cost compounds the problem. A latency spike caught at 90 seconds means replaying a few thousand events, which a healthy connector handles in well under a minute. Caught at 6 hours, you’re replaying millions of events. Or you’re determining that the replication slot has drifted too far and triggering a full re-snapshot. On a 500 GB table, a re-snapshot can run for hours and puts real read pressure on the source database during business hours. The operational cost of catching failures late is not linear.
Most teams have alerting for one failure category: the connector goes down. Silent failures belong in the other category. The pipeline falls behind, quietly, and no state-change alert fires because the connector never stopped running. That’s the gap this post is about.
Latency-Creep Detection: Signal Design and Thresholds
End-to-end pipeline latency is the primary signal to track. It measures the delay from when a change commits at the source to when it arrives at the destination. Streamkap exposes this as the latency field in the pipeline metrics API, alongside recordsLag, the count of records waiting to be processed by downstream consumers.
For PostgreSQL sources, WAL slot lag gives you an earlier warning, before events even enter the pipeline. The gap between pg_current_wal_lsn() and the slot’s restart_lsn shows how far behind the connector is at the database level:
SELECT pg_size_pretty(pg_wal_lsn_diff(pg_current_wal_lsn(), restart_lsn))
FROM pg_replication_slots
WHERE slot_name = 'streamkap_slot';
Monitoring WAL lag at the slot level surfaces replication problems before they propagate to destination latency metrics. Datadog exposes this as postgresql.wal_bytes; Grafana can pull from pg_stat_replication.flush_lag. Either gives you a metric you can threshold before the lag has had time to accumulate in your downstream tables.
Streamkap’s built-in alert fires when pipeline latency exceeds 10 minutes. That’s a reasonable default, but it misses the slow-burn case. A percentile-based threshold on the raw latency metric catches more: a p95 alert at 90 seconds fires during a sustained load spike that hasn’t crossed the 10-minute mark yet. Average-based thresholds tend to smooth over exactly the kind of gradual accumulation that signals latency creep.
Dead-letter queue activity is the third signal. A DLQ event almost always means a schema change caused a deserialization failure, or a downstream write constraint rejected an event. Alerting on DLQ topic record counts, not just peak spikes, lets you catch low-volume systemic issues before they build into a large backlog. A DLQ filling at 50 records per hour looks quiet in isolation; after 8 hours it represents 400 lost events and a non-trivial data quality problem.
Together, slot lag, pipeline latency, and DLQ rate give you three independent readings of pipeline health. Any one of them can fail to fire on a given incident; monitoring all three creates redundancy in your detection coverage.
Durable Log-Position Recovery: Avoiding Re-Snapshots
When a CDC connector restarts after an outage, it reads its stored offset from the message broker and asks the source database for the matching log position. For PostgreSQL, that means locating the LSN in the active replication slot. If the slot is intact and WAL was retained far enough back, the connector resumes from that checkpoint without manual intervention. No re-snapshot, no data gap.
The failure mode worth planning for: the slot is gone. Database upgrades are the most common cause. PostgreSQL removes replication slots during a major version upgrade and doesn’t restore them. When the connector restarts and requests its stored offset, the slot no longer exists. A new slot gets created, but it only captures changes from the moment of its creation. The connector resumes from the latest log position, skipping whatever accumulated during the upgrade window, and that gap causes silent data loss with no warnings in the connector logs.
The mitigation is operational: verify slot state before and after any major database change, and treat slot recreation as an event that requires a data audit rather than just a connector restart.
WAL retention determines how large your recovery window is. Streamkap recommends a minimum of 3 days of WAL, with 5 days preferred for troubleshooting headroom. A 72-hour buffer means a connector that goes offline Friday evening can catch up Monday morning from checkpoint. Cutting WAL retention to save disk space is a trade-off that bets your outages stay short, a bet that doesn’t always pay out.
Low-traffic databases need explicit attention here. Without regular write activity, the replication slot’s position doesn’t advance, and PostgreSQL keeps retaining WAL files because the slot signals it still needs them. Enabling heartbeats keeps the slot position advancing even when application traffic is quiet, prevents WAL accumulation, and ensures your recovery window stays predictable. A database with 10 transactions per hour still needs the slot to tick forward.
Building the Alert Contract: Routing to Slack, Datadog, Webhooks
The most common alerting mistake isn’t missing alerts. It’s flattening them. When “pipeline stopped unexpectedly” and “pipeline latency above threshold” arrive in the same Slack channel at the same urgency, on-call engineers start treating both as background noise. Alert desensitization is how the critical notifications get missed.
A workable approach separates alerts by the action they require. Failures that need a human within minutes (pipeline stopped unexpectedly, a DLQ spike that suggests systemic schema drift rather than isolated bad events) belong in PagerDuty or a dedicated on-call Slack channel with explicit escalation. These shouldn’t share a channel with anything lower-priority.
Latency breaches belong in a separate tier. When pipeline latency crosses your SLA threshold, the team should know, but they don’t need to wake up at 2 AM if the recovery alert follows within a few minutes. Route these to a monitoring channel and let the recovery notification close the loop without requiring manual acknowledgment.
Trending signals sit in a third category: slowly growing consumer group lag, WAL accumulation trending up but below the critical threshold, low-volume DLQ activity. These feed into Datadog or Grafana as metric annotations rather than chat notifications. You’re not paging anyone; you’re building the record that helps diagnose the next incident.
Streamkap’s alerting supports Slack, Datadog, PagerDuty, Grafana, Splunk, and custom webhooks, with each alert type configurable independently. Pipeline latency above 10 minutes, DLQ triggered, and pipeline not running each have their own channel preferences, so you’re not stuck pushing everything through a single integration.
Recovery notifications matter as much as trigger alerts. Streamkap fires when a pipeline returns to running state and when latency drops back below threshold. Pairing trigger and recovery alerts means an on-call engineer sees the full incident arc in their notification feed without querying a dashboard. For a latency breach that self-resolves in 4 minutes, a recovery alert within that window communicates “watch but don’t act.” Without it, the engineer has to pull up the metrics manually to make that call.
When using the webhook integration for Grafana or a custom receiver, the payload includes entity_name, action_type, threshold_value, and a direct link to the resource in the Streamkap app. Write your notification templates to surface those fields. An alert that names the specific pipeline, shows the exact threshold breached, and links directly to the connector detail page makes triage possible in the notification itself. That’s the difference between an alert that tells you something broke and one that tells you where to look.
Where to next?
Streamkap Team
LinkedInAuthor Bio
The Streamkap team builds modern real-time data infrastructure to help companies sync data between systems.
Published
June 3, 2026
TL;DR
• Track WAL slot lag and consumer group lag, not just connector state: latency creep costs more than hard crashes • Durable log-position recovery avoids re-snapshots when a connector restarts, but only if the replication slot survives • Route alerts by severity so your team gets actionable notifications across Slack, Datadog, and PagerDuty
Related blog posts
Batch Processing vs Real-Time Stream Processing
There is a big movement underway in the migration from batch ETL to real-time streaming ETL but what does that mean? How do these methods compare? While real-time data streaming has many advantages over batch processing, it is not always the right choice depending on the use case so let's take a loo
CDC Cost Optimization for Streaming Destinations: Transparent Credit Math and Trade-Offs
Navigate per-row vs micro-batch pricing models for Snowflake, BigQuery, and Redshift CDC sinks. Learn how to forecast streaming costs before adoption and avoid bill surprises.
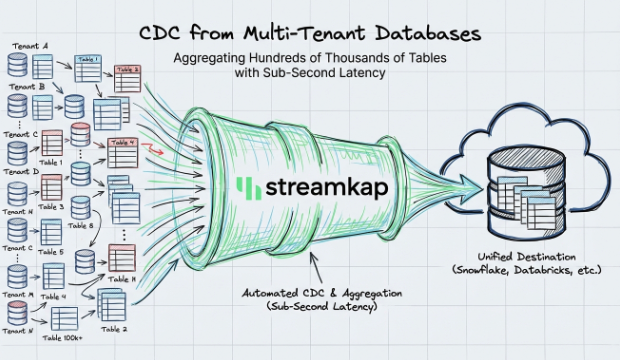
CDC from Multi-Tenant Databases with Sub-Second Latency
How Streamkap handles CDC at scale across multi-tenant databases with thousands of schemas, delivering sub-second latency without managing Kafka or Flink.